Content Engagement Metrics: How To Measure What Matters

Publishing content consistently is only half the equation. The other half is knowing whether that content actually resonates with your audience. That's where content engagement metrics come in, they're the concrete numbers that tell you if people are reading, clicking, sharing, or bouncing away from what you've created. Without tracking them, you're essentially publishing into a void and hoping for the best.
The challenge is that there are dozens of metrics you could track, and not all of them carry equal weight. Pageviews might look impressive on a dashboard, but they say nothing about whether someone actually found your content useful. Picking the right KPIs, and understanding what they reveal, is what separates content strategies that compound over time from those that stay flat. It's also a core reason we built RankYak to optimize every article it produces around the signals that actually influence rankings and reader behavior.
This guide breaks down the engagement metrics that matter most, how to measure them across platforms, and how to use that data to make smarter decisions about your content strategy going forward.
What content engagement metrics are
Content engagement metrics are the data points that measure how people interact with your content after they find it. They go beyond simply counting how many people arrived at a page and instead focus on what those visitors actually did: Did they read to the bottom? Did they click a link? Did they share the article or come back for more? These metrics give you a window into the quality of the experience your content delivers, not just the volume of traffic it attracts.
Publishing without tracking engagement is like writing letters and never knowing if anyone read past the first line. Engagement metrics correct for that blind spot by showing you whether your content holds attention, prompts action, and delivers real value to the people who land on it.
The difference between traffic metrics and engagement metrics
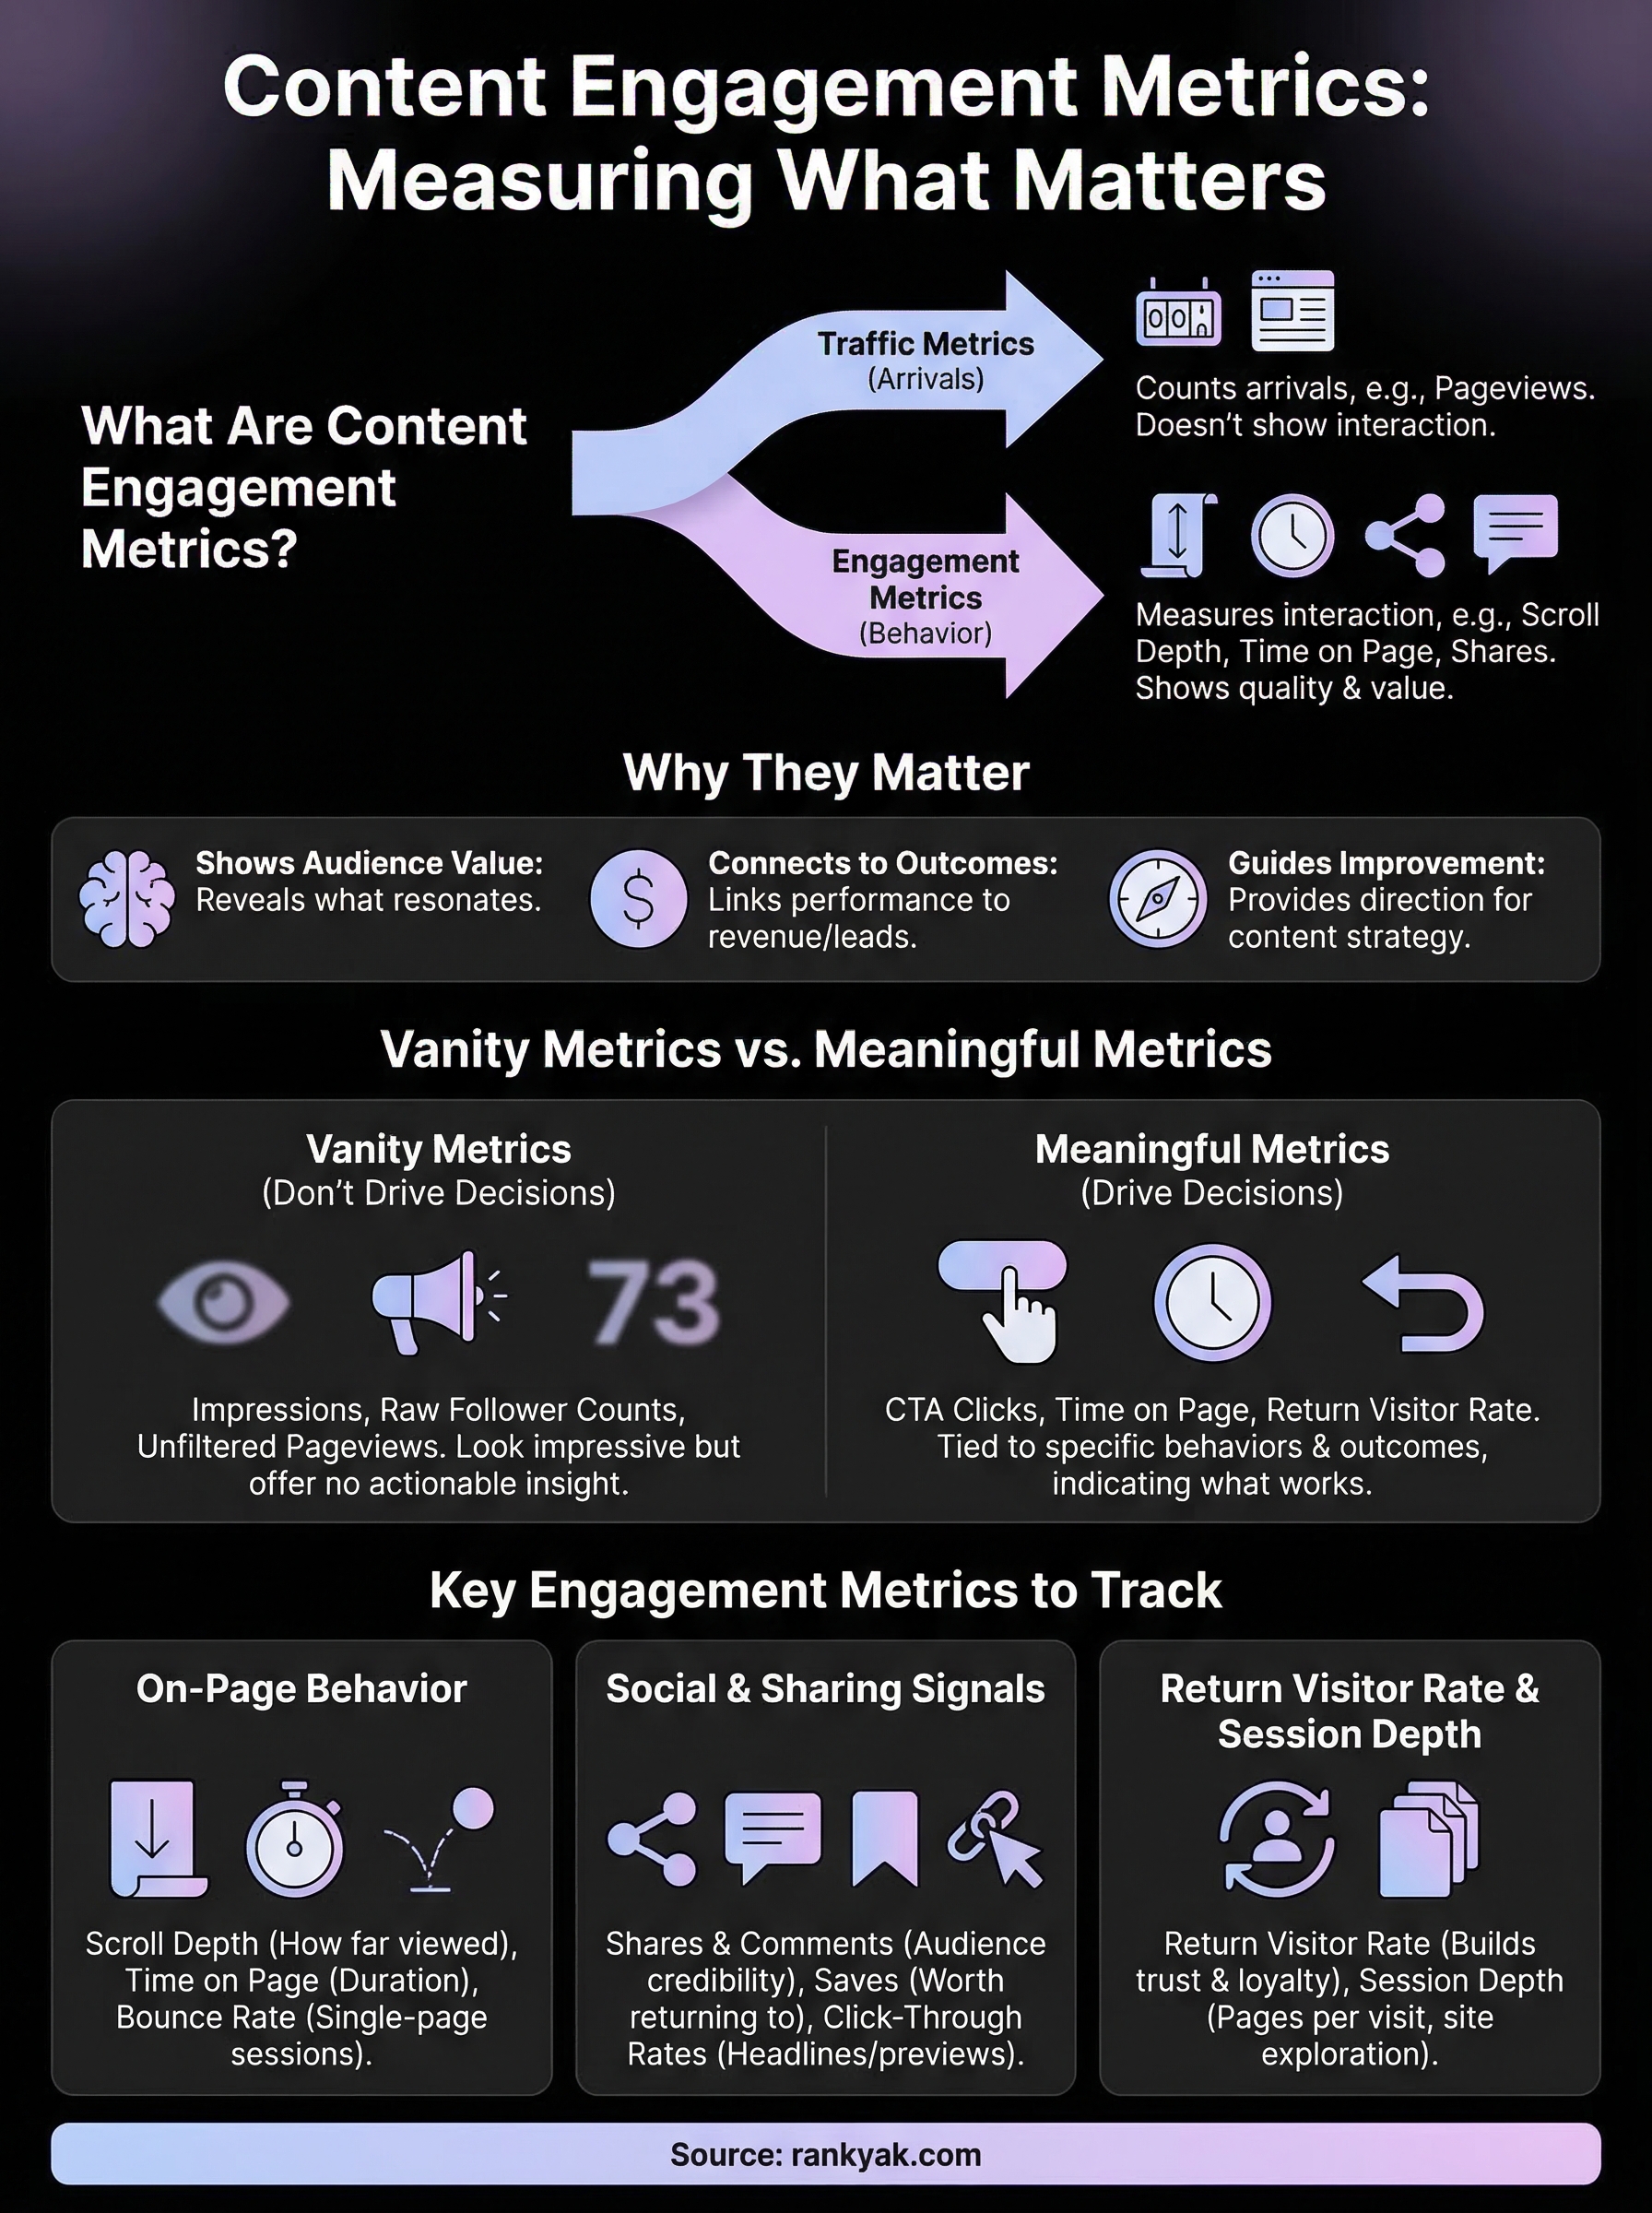
Traffic metrics count arrivals. Engagement metrics measure behavior. A pageview tells you someone loaded a URL. A scroll depth measurement tells you how far down the page they got. A session duration tells you how long they stayed. These are fundamentally different types of information, and conflating them leads to poor content decisions.
Tracking only traffic metrics is like counting how many people walk into a store without knowing whether any of them bought something.
Traffic data is still useful because it helps you understand reach and discovery. Engagement data is what tells you whether your content is doing its job once people get there. Both belong in your content reporting, but engagement metrics are the ones that directly reflect content quality.
How engagement is defined across different platforms
Engagement looks different depending on where your content lives. On a blog or website, engagement might mean time on page, scroll depth, or internal link clicks. On social media, it means likes, shares, comments, and saves. On video platforms, it means watch time and completion rates. On email, it means open rates, click-through rates, and replies.
What stays consistent across all these platforms is the underlying question you are trying to answer: did this content connect with the person who encountered it? Each platform gives you different signals to answer that question, but the goal is the same. You want to know whether your content earned attention or just received it passively.
Vanity metrics vs. metrics that drive decisions
Some numbers look impressive in a report but do not tell you anything actionable. Total impressions, raw follower counts, and unfiltered pageviews fall into this category. They are not completely useless, but they become vanity metrics the moment you treat them as proof of content success without digging deeper into what the audience actually did.
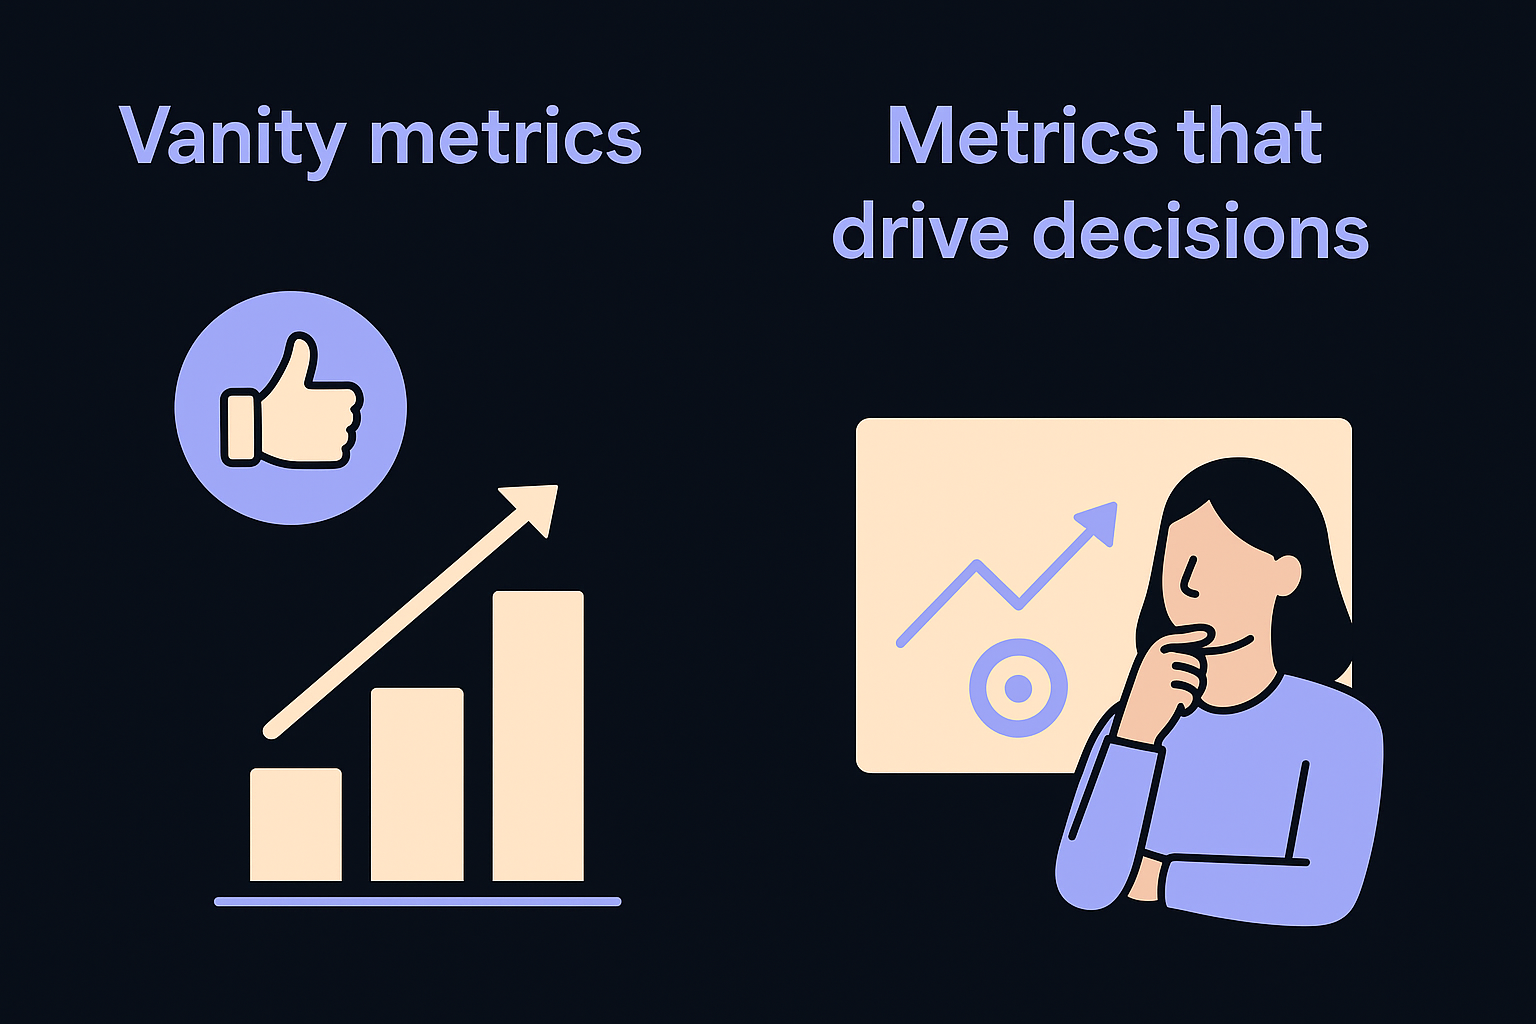
Meaningful engagement metrics are the ones tied to a specific behavior or outcome. Did someone click your call-to-action? Did they spend enough time on the page to actually read it? Did they return to your site within a week? These are the metrics worth building your strategy around because they show you what is working, what is falling flat, and where to focus your effort next. Recognizing this distinction is the foundation of any content measurement approach that produces results you can act on.
Why content engagement metrics matter
Content decisions made without data are essentially guesses. You might publish consistently, cover the right topics, and format your articles well, but if you are not tracking how your audience responds, you have no reliable way to know what is working. Content engagement metrics give you the feedback loop that turns content creation from a guessing game into a repeatable, improvable process.
They show you what your audience actually values
People vote with their behavior. When readers spend four minutes on an article, scroll to the bottom, and click a related link, they are telling you something important about that content. When they bounce in under thirty seconds, they are telling you something equally important. Engagement data surfaces these signals at scale, so you can spot patterns across dozens of pieces of content rather than relying on gut feeling.
Your audience tells you what they value every time they interact with your content. Engagement metrics are how you listen.
Tracking engagement across your content library lets you identify which formats, topics, and structures consistently hold attention. That knowledge directly shapes what you create next and removes a lot of the uncertainty from your editorial decisions.
They connect content performance to business outcomes
Traffic numbers feel good, but they rarely tell you whether content is contributing to revenue, leads, or customer retention. Engagement metrics bridge that gap. A high click-through rate on a call-to-action paragraph means your content is moving people further into your funnel. A strong return visitor rate means your content is building the kind of trust that makes people come back, which is a direct precursor to conversion.
Without this layer of measurement, it is nearly impossible to justify content investment to stakeholders or make a confident case for scaling up production.
They give your content strategy a direction for improvement
Knowing that a piece of content underperformed is only useful if you understand why. Engagement metrics point you toward the specific problem: high bounce rates suggest a mismatch between your headline and your content, low scroll depth suggests your opening is not pulling people in, and low share rates suggest the content is not hitting an emotional or practical note worth passing along. Each metric narrows the diagnostic window so you can make targeted improvements rather than rewriting blindly.
The key engagement metrics to track
Not every metric deserves a slot on your dashboard. The content engagement metrics worth tracking fall into a few clear categories based on what user behavior they actually measure. Start with these core groups and you will have a solid foundation for evaluating content performance without drowning in noise.
On-page behavior metrics
These metrics tell you what happens after someone lands on your page, which is where content quality either proves itself or falls short. Time on page measures how long a visitor stays before leaving or navigating elsewhere. Scroll depth tells you what percentage of the page they actually viewed, which matters more than time alone because someone can leave a tab open without reading a word.
A page with a high average scroll depth is a strong signal that your content structure and opening paragraphs are pulling readers forward.
Bounce rate rounds out this group. A high bounce rate on an article that is supposed to drive further site exploration suggests either a content-to-intent mismatch or a weak internal linking structure. Tracking these three together gives you a clear picture of whether your content is earning the attention it receives.
Social and sharing signals
When someone shares your content, they are putting their own credibility behind it, which makes shares one of the most honest signals of content value. Track share counts across platforms, but pay equal attention to comment activity and saves, since saves (on platforms that support them) often indicate that someone found the content worth returning to later.
Click-through rates on social posts also fall into this category. A high impression count paired with a low click-through rate tells you your headline or preview image is not matching what your audience wants to engage with, and that is a fixable problem once you can see the data.
Return visitor rate and session depth
Return visitor rate measures the percentage of your audience that comes back to your site after their first visit. A growing return visitor rate means your content is building genuine trust rather than just capturing one-time traffic. Session depth, meaning the number of pages a visitor views in a single visit, complements this by showing whether individual pieces of content are strong enough to pull someone deeper into your site.
Track both metrics together to understand whether your content is building a loyal audience or simply generating isolated visits with no lasting connection.
How to measure engagement across channels
Measuring content engagement metrics effectively means using the right tools for each environment where your content lives. Each channel has its own native analytics, and pulling data from the right sources ensures you are working with accurate, behavior-specific signals rather than rough estimates. The good news is that most of the measurement infrastructure you need either already exists or takes minimal setup to activate.
Website and blog analytics
Google Search Console and Google Analytics (GA4) are the two tools you need for tracking on-site engagement. Search Console shows you click-through rates, impressions, and average position for your content in search results, which tells you how well your titles and meta descriptions are pulling in clicks. GA4 goes deeper, giving you scroll depth data, session duration, pages per session, and return visitor rates through its engagement reports.

Setting up GA4's enhanced measurement features takes under five minutes and unlocks scroll tracking, outbound click tracking, and site search data automatically.
Within GA4, the Engagement overview report breaks down engaged sessions (sessions lasting longer than ten seconds or involving multiple page views) separately from raw sessions, which gives you a cleaner signal of content quality than simple visit counts alone.
Social media platforms
Each major social platform gives you built-in analytics for the content you publish natively. Focus on reach versus engagement rate rather than raw follower counts. A post reaching 500 people with a 10% engagement rate tells you more about content resonance than one reaching 5,000 people with a 1% rate. Saves and shares carry more weight than likes because they indicate your audience found the content worth revisiting or passing along.
Reviewing your social analytics weekly helps you spot which content formats and topics consistently outperform others, so you can prioritize what your specific audience responds to rather than chasing general platform trends.
Email campaigns
Your email platform tracks open rates, click-through rates, and unsubscribe rates for every campaign you send. Open rates measure subject line effectiveness, while click-through rates measure how well your content and calls-to-action land once someone opens the email. A low click-through rate paired with a high open rate usually signals a mismatch between what your subject line promised and what you delivered inside.
Segmenting your email data by campaign type lets you compare content newsletters against promotional sends without mixing signals that carry different baseline benchmarks, which keeps your performance comparisons accurate.
How to turn metrics into better content
Collecting content engagement metrics is only useful if you act on what they tell you. Data sitting in a dashboard does not improve your content. The real value comes when you treat your metrics as a diagnostic tool, using them to identify specific problems in specific pieces of content and then making targeted changes based on what you find.
Use underperforming content as your first signal
Start with the content that already exists on your site. Sort your pages by average scroll depth and time on page to find articles where readers are consistently dropping off early. These pieces are your highest-priority targets because they already have traffic, which means improving them delivers faster results than starting from scratch.
A page with strong impressions but low scroll depth almost always has one of two problems: a weak opening paragraph or a headline that overpromises what the article delivers.
Once you identify a low-scroll article, read the first three paragraphs critically. If the opening does not immediately confirm that the reader landed on the right page, rewrite it so it does. Then check whether your subheadings are pulling the reader forward through the piece. Weak subheadings are a common reason readers stop scrolling midway through otherwise solid content.
Build a feedback loop into your publishing process
Improving content is not a one-time audit. You need a repeatable review cycle built into how you publish. Set a monthly calendar reminder to pull engagement data from GA4 and your social analytics, then run a short review of your five lowest-performing pieces from the past 90 days. This keeps the improvement process manageable without letting underperforming content sit unchanged for months.
Pair this with a simple tracking doc where you log the changes you make to each piece and the date you made them. Revisit that page four weeks later to see whether the engagement numbers shifted. This before-and-after comparison is the most direct way to confirm whether your edits actually helped, and it builds your own evidence base for what types of improvements consistently move the needle on your site. Over time, patterns will emerge, and those patterns will shape how you write new content from the first draft rather than relying on fixes after the fact.
Final takeaways
Content engagement metrics give you the clearest possible picture of whether your content is actually working or just occupying space on your site. The metrics covered in this guide, from scroll depth and time on page to return visitor rates and email click-throughs, each measure a specific behavior that tells you something distinct about content quality. Tracking them consistently turns your content strategy from a series of educated guesses into a process you can measure, adjust, and improve over time.
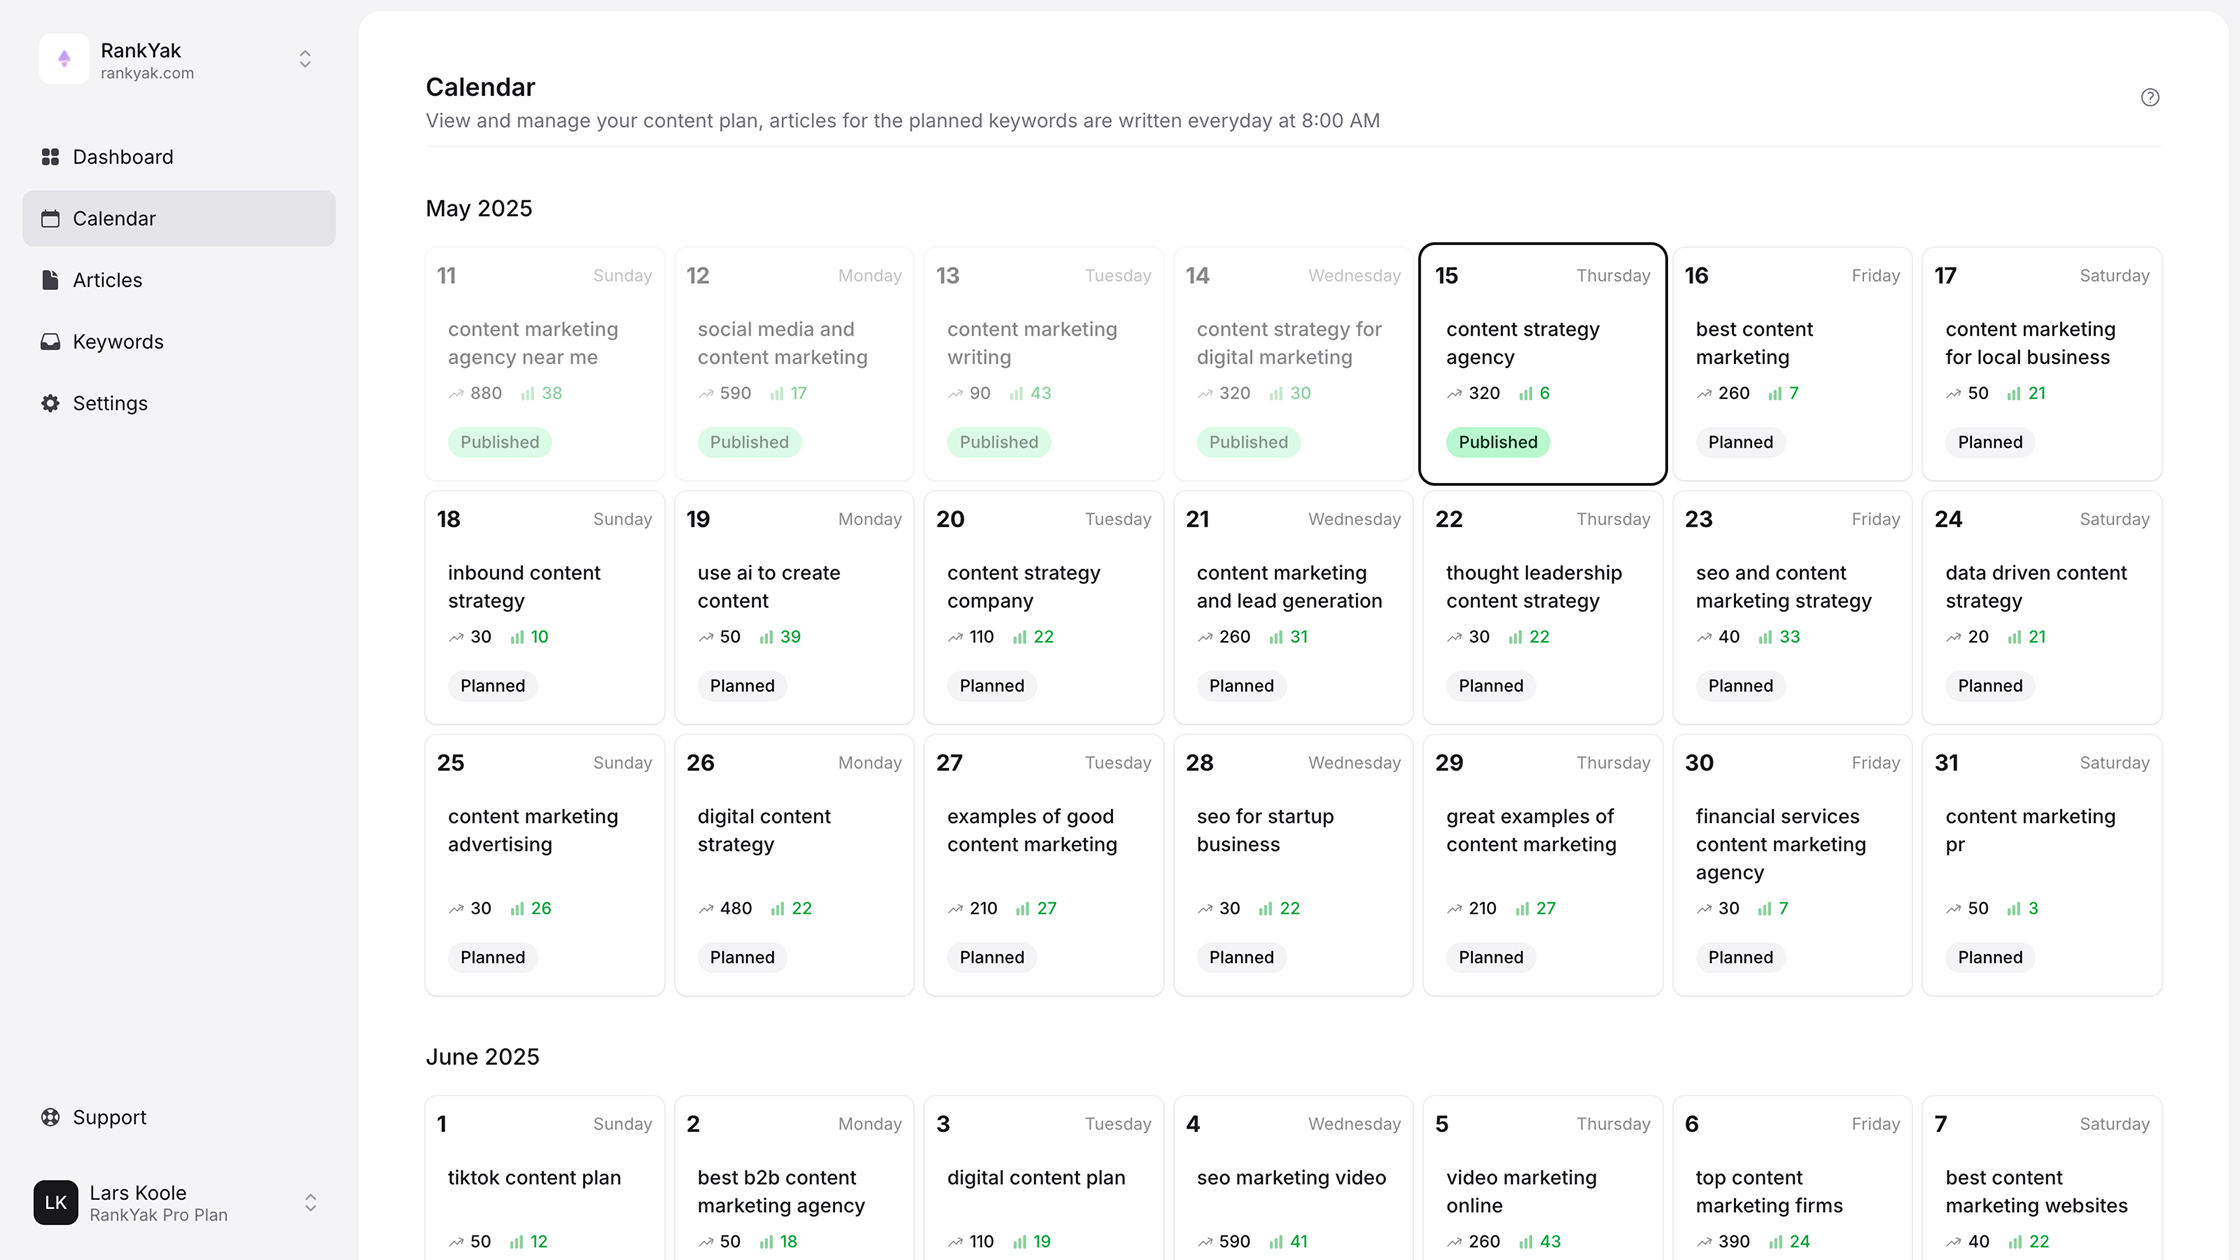
Start with the data you already have access to through GA4 and your platform analytics. Fix your lowest-performing pages first, build a monthly review habit, and let the patterns you find shape how you write new content from the start. If you want a faster way to produce articles built around these signals from day one, RankYak's automated SEO platform handles the research, writing, and optimization so your content is set up to perform before it even goes live.

Get Google and ChatGPT traffic on autopilot.
Start today and generate your first article within 15 minutes.
SEO revenue calculator
How much revenue is your website leaving on the table?
Take a quick quiz and see exactly how much organic revenue you're missing out on, along with personalized tips to fix it.
-
4 questions, under 1 minute
-
See traffic and revenue potential
-
No email required
Free · takes 1 minute · no signup needed
Question 1 of 4
Question 2 of 4
Question 3 of 4
Question 4 of 4
Your SEO growth potential
Extra visitors / month
after 6-12 months of consistent publishing
Revenue potential / year
at your niche's avg. conversion rate
Articles needed (12 mo)
to reach this traffic level
ROI with RankYak
on the Professional plan ($129/mo)
To hit that number, you'd need to:
- Build a topical authority strategy for your niche
- Research keywords & map out a full topical cluster
- Write, edit & publish an article every single day
- Build backlinks to the articles you publish
RankYak handles all of this automatically, every day.
* Estimates based on industry averages. Results vary by niche, competition, and domain authority. Most SEO results become visible after 3-6 months of consistent publishing.