Top 13 Content Marketing Analytics Tools (2026 Free & Paid)

You're producing content, shipping posts, and juggling dashboards, yet it's still hard to answer simple questions: Which pieces actually move the needle? Where are readers dropping off? What should you double down on next week? Content teams often piece together website analytics, SEO data, social stats, and heatmaps, but the result is noisy, slow, and disconnected from revenue.
If you're a content marketing specialist wondering why you can't track which blog posts actually generate leads, you're not alone. Most analytics setups measure pageviews and sessions but never connect a specific article to a form fill, a demo request, or a sale. The fix isn't more data, it's the right content analytics software wired to your goals. The best content analytics platform for marketers combines traffic and search data with engagement signals and conversion attribution so you can follow a reader from first click to closed deal. That means choosing tools for content performance tracking that go beyond vanity metrics and actually tie content engagement analytics to pipeline and revenue.
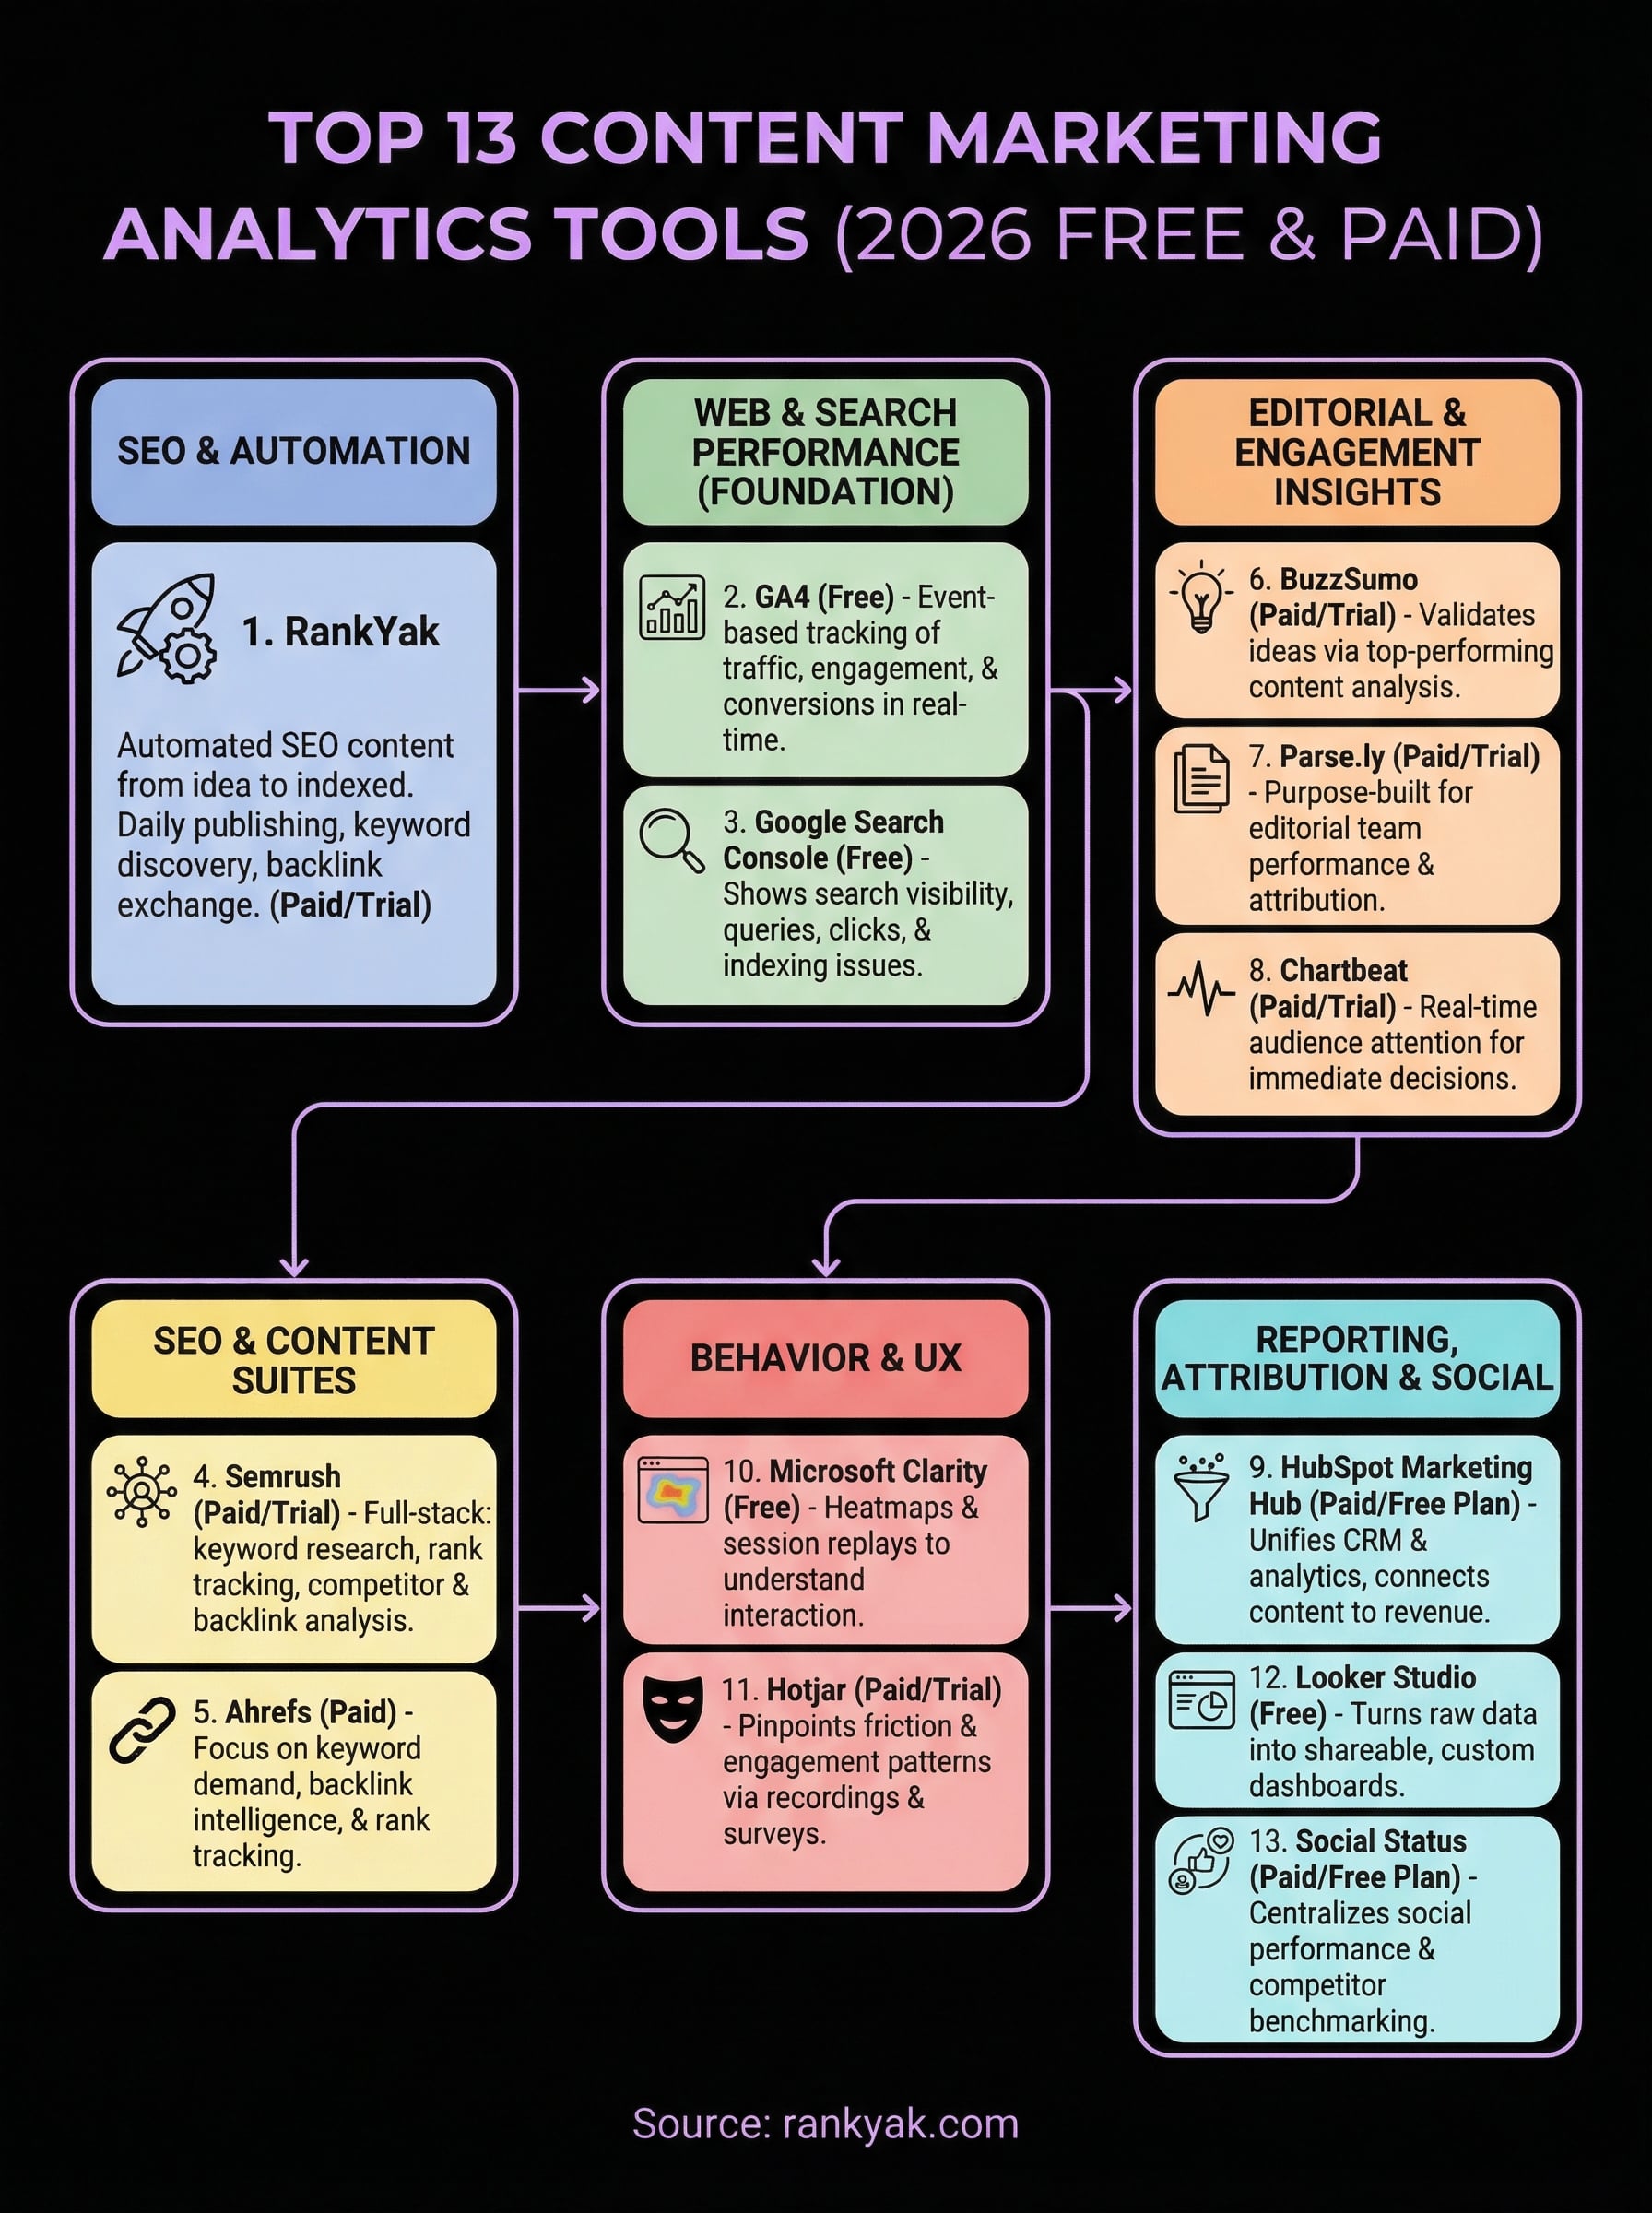
This guide cuts through the noise. We've curated the 13 best content marketing analytics tools for 2026, free and paid, covering web and search performance (GA4, Search Console), SEO and topic opportunities (Semrush, Ahrefs), editorial analytics (Parse.ly, Chartbeat), behavior insights (Microsoft Clarity, Hotjar), reporting (Looker Studio), social reporting (Social Status), and a fully automated SEO engine with built‑in analytics (RankYak). For each, you'll see what it does, the key metrics it unlocks, who it's best for, pricing and trials, plus practical notes on where it shines. We also note where analytics and SEO tool integrations for content platforms (GA4, Semrush, Ahrefs, and others) connect so you can build a unified stack rather than collect disconnected screenshots. Whether you need a free content analytics dashboard to share with stakeholders or a full-stack best CMS for content marketing analytics and strategy, there's a fit on this list. Skim to find your quick win, or read through to build a stack that ties content to traffic, engagement, and conversions. Let's get you from "lots of data" to clear decisions.
1. RankYak
What it does
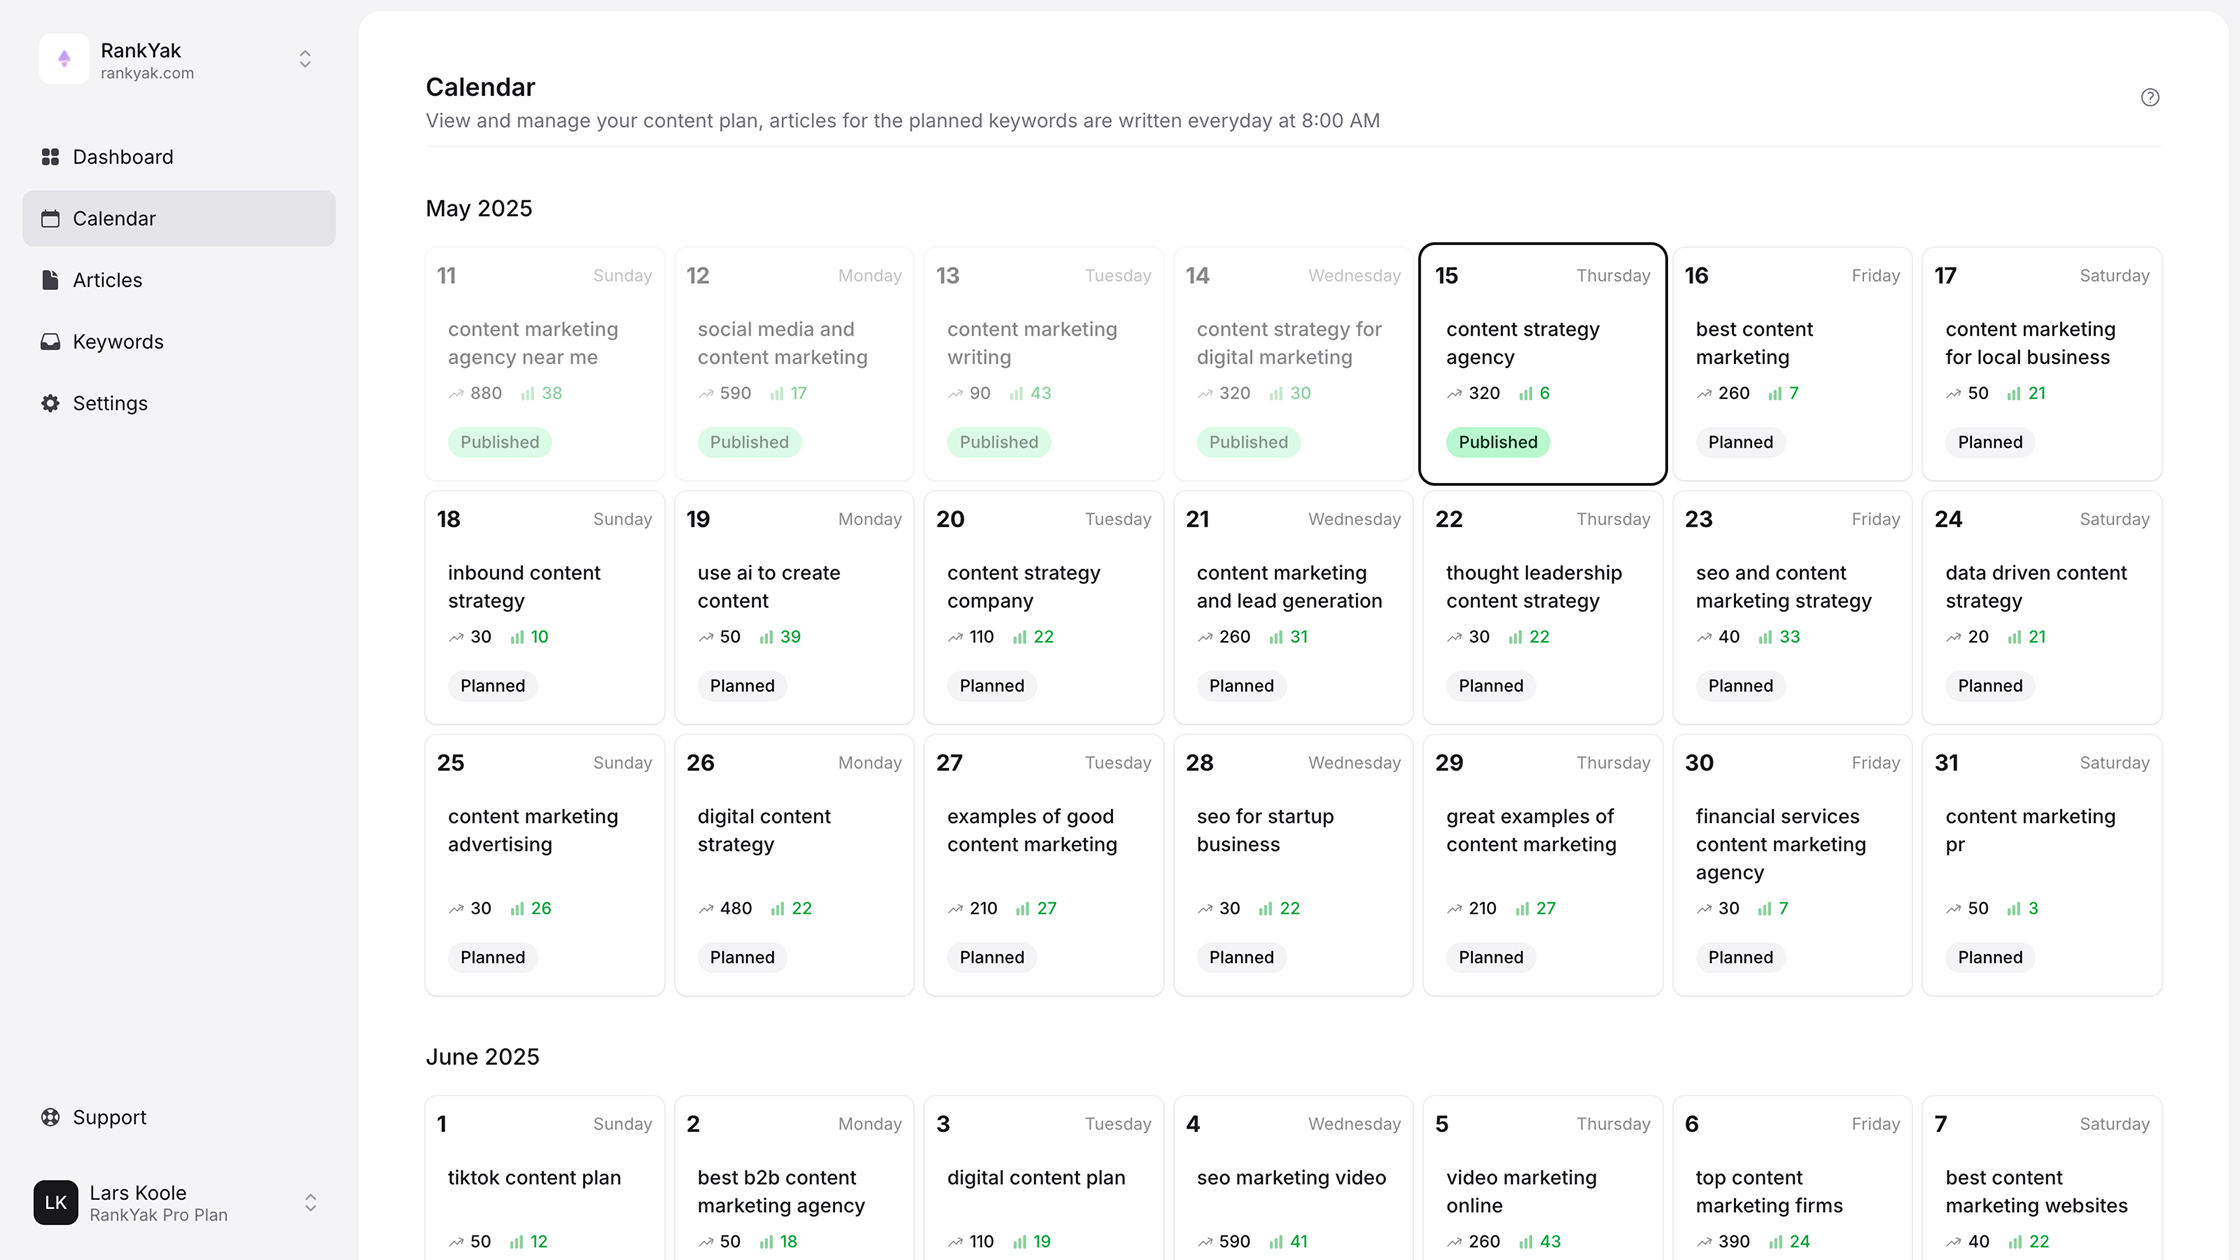
RankYak is an all‑in‑one SEO automation platform that takes your content from idea to indexed without the spreadsheet shuffle. It automatically discovers high‑potential keywords for your site and niche, generates a daily content roadmap, writes fully SEO‑optimized articles (up to 5,000 words with featured images), publishes straight to your CMS (WordPress, Shopify, Webflow, Wix, custom CMS), and even facilitates backlink exchange to grow authority. It's built to optimize for both Google and AI chats, adapts to your brand voice across 40+ languages, supports multi‑site management, and hooks into Zapier/Make or your own stack via API/webhooks.
Key analytics features
RankYak focuses on turning performance signals into action so your content plan compounds week over week.
- Smart keyword discovery: Automatically identifies high‑potential keywords based on your website and niche to target topics with the best upside.
- Search Console integration: Uses Google Search Console data to inform targeting and monitor queries, clicks, and impressions as articles roll out.
- Topic cluster + internal linking frameworks: Builds structured coverage and linking paths to strengthen topical authority and improve findability.
- Consistency by design: A daily publishing plan keeps cadence on track so you can correlate output with traffic gains and ranking lift.
- Backlink exchange facilitation: Streamlines acquiring relevant links to support rankings and amplify content performance.
Best for
SMBs, founders, and lean content teams who want content marketing analytics tied directly to an automated SEO engine, plus agencies managing multiple sites that need reliable cadence, quality, and scale without stitching together five tools.
Pricing and trial
One straightforward plan: $99/month with all features included. Try it with a 3‑day free trial you can cancel anytime, no questions asked. RankYak's promise: 10x faster execution, 90% less time spent on SEO busywork, and more content ranking through intent‑driven research, competitor analysis, and Search Console‑informed iteration.
2. Google Analytics 4 (GA4)
2. Google Analytics 4 (GA4)
What it does
GA4 is the free, event‑based analytics platform from Google that gives content teams a clear view of how people find, engage with, and convert on your site. It tracks traffic sources, on‑page engagement, and conversions in real time, then connects those behaviors to marketing outcomes so you can see which content drives results. GA4 also pairs well with Looker Studio for flexible reporting, letting you turn raw engagement data into dashboards your team and stakeholders actually use.
Key analytics features
GA4 earns its place among top content marketing analytics tools by combining breadth of reporting with actionable analysis. It's a core building block of the best content analytics dashboards in 2026, giving marketers a free, reliable way to track content performance at scale.
- Real‑time reporting: Monitor active users, top pages, and traffic spikes as they happen to validate launches and promotions.
- Acquisition and engagement reports: See which channels and pieces keep users on page and moving deeper into your site.
- Monetization and conversion tracking: Measure goal completions and revenue impacts tied to specific content and campaigns, critical if you need to trace which blog posts generate leads and downstream deals.
- Funnel exploration: Build step‑by‑step funnels to pinpoint where readers drop off and where optimization will pay off.
- Segment overlap: Compare audiences to spot shared traits of high‑value readers and subscribers.
- Advertising attribution: Evaluate how paid and owned touchpoints contribute to conversions.
- Predictive insights and privacy‑safe modeling: Surface trends and fill gaps where user‑level data isn't available.
- Event configuration and custom tables: Define the interactions that matter and structure reports to match your KPIs.
Best for
Teams that need a reliable, free source of truth for web content performance, marketers, editors, and SMBs who want to connect acquisition, engagement, and conversions without extra cost. Also a strong fit for organizations standardizing reporting in Looker Studio.
Pricing and trial
GA4 is free. For enterprises that need advanced features and support, Google Analytics 360 is available starting around $50,000/year. You can start tracking immediately on the free plan and expand to 360 when governance, scale, or SLAs require it.
3. Google Search Console
What it does
Google Search Console (GSC) shows how your content performs in Google Search so you can connect topics to queries, rankings, and clicks. Unlike on‑site analytics, GSC focuses on search visibility: which pages get discovered, which keywords drive impressions, and how your snippets convert. It also flags indexing issues so content you publish actually gets crawled and surfaced.
Key analytics features
GSC earns a spot among the must‑have content marketing analytics tools because it ties every article to real search demand and technical discoverability.
- Search Performance: Track queries, pages, impressions, clicks, click‑through rate, and average position to see what's rising, stalling, or slipping.
- Filters and comparisons: Slice by date, query, page, country, and device to find wins and opportunities at the topic level.
- Index coverage + sitemap submission: See which URLs are indexed, which are excluded, and why, then submit sitemaps to speed discovery.
- URL inspection: Check a single page's index status and request reindexing after updates.
- Links report: View top external links and internal link distribution to spot authority gaps and internal linking fixes.
Best for
SEO‑minded marketers, editors, and SMBs who want a direct line from content to search demand. It's ideal for prioritizing topics, refining titles/meta to lift CTR, and resolving indexing issues that quietly cap your traffic.
Pricing and trial
GSC is free. Connect your property, verify ownership, and you'll start seeing search data as Google crawls and serves your pages. Pair it with GA4 for on‑site behavior and with a reporting layer (e.g., Looker Studio) to share insights with stakeholders.
4. Semrush
What it does
Semrush is a full‑stack SEO and content marketing platform that helps you go from topic discovery to measurable traffic gains. It specializes in keyword research, competitive intelligence, backlink analysis, and campaign optimization, and it also supports PPC and social reporting so you can see how content influences both organic and paid outcomes. For teams evaluating content marketing analytics tools, Semrush shines by connecting research, execution, and performance tracking in one place.
Key analytics features
Semrush gives you the signals you need to pick winning topics, publish with confidence, and monitor impact.
- Keyword & topic research: Surface high‑potential keywords, related topics, and difficulty to prioritize content with realistic upside.
- Position tracking: Monitor daily rankings by page, device, and location to see which pieces climb, stall, or slip.
- Backlink analytics & auditing: Analyze referring domains, compare competitors, and find link gaps to strengthen authority.
- Site audit & technical SEO checks: Spot and fix issues that limit crawlability and performance before they cap growth.
- PPC and social insights: Use ad and social performance metrics alongside SEO data to improve click‑through rates and messaging.
- Competitor analysis: Benchmark content coverage, keywords, and links to map exactly where you can outrank.
Best for
Content and SEO teams that want a single workspace to research topics, brief writers, monitor rankings, and report outcomes, plus marketers who need to align organic content with PPC and social efforts. Great for agencies and in‑house teams that rely on competitive benchmarking to guide their editorial calendar.
Pricing and trial
Semrush pricing starts from US$139.95/month with a free trial available. That entry tier covers core research and tracking; you can add advanced modules as your program scales and your reporting needs deepen.
5. Ahrefs
What it does
Ahrefs is a widely used SEO platform that helps content teams research topics, size up competitors, and track how published pieces acquire rankings and links over time. For content marketing analytics, it brings together keyword demand, SERP difficulty signals, backlink intelligence, rank movement, and site health so you can pick the right topics, publish with confidence, and measure impact beyond pageviews.
Key analytics features
Ahrefs earns a spot among content marketing analytics tools because it translates search and link data into clear editorial moves.
- Keyword and topic research: Estimate demand and difficulty to prioritize content that can realistically rank and drive compounding traffic.
- Backlink analysis: See which pages attract links, the quality of referring domains, and where competitors earn authority you can target.
- Rank tracking: Monitor positions by keyword and URL to spot winners, early movers, and pages that need refreshes.
- Content gap comparisons: Identify keywords and topics competitors rank for that you don't, then map them into briefs.
- Site auditing: Surface crawl issues that can quietly cap visibility, from broken links to thin or duplicate content.
- Link opportunity discovery: Uncover domains that link to competitors but not you to focus outreach where it's most likely to land.
Best for
Content and SEO teams that want competitive clarity, what to write next, which pages to update, and where to build authority. Great for editors who need to justify topics with data and for agencies that benchmark clients against category leaders.
Pricing and trial
Current plan details and any trial options are available on the vendor's website. Choose a plan based on your research, tracking, and crawl needs; limits typically scale with team size and scope. If you're evaluating, start with a narrow set of target keywords and competitors to validate fit before rolling it out to your full content program.
6. BuzzSumo
What it does
BuzzSumo helps content teams validate ideas before they invest time writing. It analyzes which articles and formats get traction across the web so you can spot topics, angles, and headlines with a higher probability of engagement. Used alongside other content marketing analytics tools, it gives you quick competitive context and evidence to prioritize what to publish next.
Key analytics features
- Topic discovery by engagement: See which themes and angles resonate so you can target ideas with proven interest.
- Content benchmarking: Compare top‑performing pieces across domains to understand length, format, and headline patterns that win.
- Question and ideation research: Surface common questions and subtopics to shape briefs that match reader intent.
- Trend tracking: Identify rising topics early and time content while interest is peaking.
- Competitor content insights: Map gaps in your coverage versus category leaders to inform your editorial calendar.
- Shareable reports: Package findings for stakeholders to align pitching, production, and promotion.
Best for
Editors and content marketers who want fast, evidence‑based idea validation and headline testing. Great for lean teams that need to prioritize topics with the best chance of engagement, and agencies building data‑backed content strategies and pitches for clients.
Pricing and trial
Plan details and any trial options are available on the vendor's website. Choose a tier based on how many searches, projects, and exports your editorial workflow requires, and validate fit with a narrow set of topics before rolling it out team‑wide.
7. Parse.ly
What it does
Parse.ly is built for editorial and content teams that need clarity on which stories, themes, and channels actually perform. Instead of stitching together SEO, web, and social numbers, it focuses your view on content outcomes, helping you spot winners, double down on topics that resonate, and share clean, stakeholder‑ready reports. Many marketers pair it with broader SEO suites (e.g., Semrush) to connect idea validation with ongoing performance.
Key analytics features
Parse.ly earns its place among content marketing analytics tools by turning everyday publishing questions into straightforward answers.
- Post and topic performance: See which pieces, categories, and tags attract the most attention and engagement.
- Channel breakdowns: Understand how search, social, direct, and referral traffic contribute to each article's reach.
- Author and section rollups: Compare contributors and sections to guide your editorial calendar and resourcing.
- Conversions and goals: Attribute sign‑ups or other key actions back to content so you can measure business impact.
- Custom dashboards and reports: Package insights for editors, leadership, and clients without exporting spreadsheets.
Best for
Newsrooms, publishers, and content‑heavy brands that want editorial analytics purpose‑built for day‑to‑day decisions, what to promote, what to update, and what to commission next, without wading through generic web analytics.
Pricing and trial
Plan details and any trial options are available on the vendor's website. Evaluate Parse.ly with a narrow set of sections, authors, and KPIs first; once the reporting fits your workflow, roll it out across the full editorial team and standardize dashboards for stakeholders.
8. Chartbeat
What it does
Chartbeat gives editors and content teams a real‑time window into audience attention so they can promote the right stories, fix underperformers, and keep readers moving through the site. It focuses on live reading behavior, what's spiking, where visitors come from, and how far they engage, so placement, headlines, and promotion decisions happen with data rather than guesswork. For teams evaluating content marketing analytics tools, Chartbeat stands out for its newsroom‑friendly clarity and immediacy.
Key analytics features
Chartbeat centers on live, actionable signals that guide what to feature now and what to improve next.
- Real‑time traffic and top stories: See active visitors by page, section, and device to prioritize promotion and placement.
- Engagement and scroll depth: Understand how far readers make it and where attention drops so you can tighten intros and restructure content.
- Channel and referrer breakdowns: Compare search, social, direct, and internal recirculation to align headlines and packaging to the source.
- Section and author rollups: Spot which beats and bylines over‑ or under‑perform to guide commissioning and resourcing.
- Recirculation insights: Identify links and modules that keep readers on site, then replicate patterns that work.
- Custom dashboards and alerts: Build role‑specific views and notify teams when a story peaks or needs a boost.
Best for
Newsrooms, publishers, and content‑heavy brands that make frequent, time‑sensitive decisions about homepage placement, promotion, and updates. It's ideal for editors who want simple, real‑time evidence to back judgment calls and for stakeholders who need clear, shared dashboards.
Pricing and trial
Plan details and any trial options are available on the vendor's website. Pilot Chartbeat with a core set of sections and KPIs, validate that the live signals change your placement and promotion decisions, then standardize dashboards across the wider editorial team.
9. HubSpot Marketing Hub
What it does
HubSpot Marketing Hub unifies CRM, automation, and analytics so you can track how blog posts, landing pages, emails, and forms turn into contacts, qualified leads, and customers. Reporting is powered by integrated sales and marketing data, with user‑friendly dashboards and custom reports. You can run cross‑channel campaigns (email, SMS, in‑product), then measure outcomes in the same workspace, no CSV juggling required. Among content marketing analytics tools, HubSpot stands out for CRM‑connected insight. It directly solves a common pain point for content marketing specialists: connecting published articles to actual lead generation and revenue, not just traffic.
Key analytics features
HubSpot's analytics tie content engagement to lead quality and pipeline, so you can double down on what drives outcomes.
- Integrated sales + marketing dashboards: Unified reports powered by CRM, marketing, and support data.
- Web and content analytics: Built‑in web analytics and page reporting for posts, landing pages, and forms.
- Campaign performance: Roll up email, pages, and ads into campaign‑level metrics you can share with stakeholders.
- Advanced segmentation & lead scoring: Analyze segments and scores to see which content attracts high‑intent audiences.
- Workflow and funnel reporting: Visualize automation performance and track progression through key lifecycle stages.
- Ad and channel integrations: Connect Google Ads, Meta, LinkedIn, and more to consolidate performance reporting.
Best for
Internal sales and marketing teams that want an all‑in‑one platform where content, automation, and CRM live together. Strong fit for SMBs and mid‑market organizations that need clean dashboards, stakeholder‑ready reports, and clear attribution from content to contacts, deals, and revenue.
Pricing and trial
HubSpot offers a free plan and demo access. Paid tiers vary by features and number of marketing contacts; published pricing commonly starts around $800/month (plus about $45/month per additional seat), with total cost dependent on tier and contact volume. Choose the tier that matches your reporting, automation, and contact scale needs before expanding.
10. Microsoft Clarity
What it does
Microsoft Clarity gives you behavior analytics, so you can see how readers actually interact with your content, not just how many arrived. Use session replays and heatmaps to understand skim patterns, dead ends, and friction points on articles and landing pages. As part of your content marketing analytics tools stack, Clarity complements traffic metrics by explaining the "why" behind bounce, scroll depth, and conversion drop‑offs, making it easier to fix UX issues and lift engagement. For content websites that need scroll depth heatmaps and reader engagement data in 2026, Clarity is one of the strongest free options available.
Key analytics features
Clarity centers on visual, fast insights that turn layout and UX questions into straightforward next steps.
- Heatmaps (click and scroll): Spot where attention concentrates and where it fades to prioritize above‑the‑fold messaging and internal links. Scroll depth heatmaps are particularly useful for long‑form content, they show exactly which sections hold readers and where engagement drops, so you can restructure articles for stronger performance.
- Session recordings: Watch real user journeys to diagnose confusing modules, slow elements, and missed CTAs on high‑value posts.
- Friction signals: Identify patterns like rage clicks and dead clicks to uncover hidden blockers that hurt engagement.
- Segmentation & filters: Compare behavior by device type, traffic source, or page group to target fixes where they matter most.
- Insights dashboards: Surface top pages with issues, recurring behaviors, and improvement opportunities without manual digging.
- Privacy‑minded capture: See interactions and patterns while keeping sensitive inputs out of recordings.
Best for
Content and UX teams that want quick, visual evidence to improve articles, templates, and conversion paths, especially SMBs and lean teams pairing behavior insights with GA4 and Search Console to prioritize the highest‑leverage fixes.
Pricing and trial
Microsoft Clarity is completely free with no paid tiers, usage caps, or traffic limits. Sign up, add the tracking script to your site, and you'll start capturing heatmaps and session recordings immediately. Start by instrumenting a handful of key templates and top‑traffic articles, validate insights against your KPIs, then expand coverage across your content library once you see consistent lift.
11. Hotjar
What it does
Hotjar focuses on experience insights so you can understand how people actually interact with your content, not just how many arrive. It's a useful companion to GA4 and Search Console: where those quantify traffic and search visibility, Hotjar helps you pinpoint friction, spot engagement patterns, and prioritize UX fixes that lift time on page and conversions.
Key analytics features
Hotjar earns a seat in any short list of content marketing analytics tools by translating on‑page behavior into clear next steps.
- Experience insights: Visibility into clicks, scrolls, and attention patterns to refine article templates, headlines, and CTAs.
- Session‑level diagnostics: Understand real user journeys to uncover confusion, dead ends, and missed opportunities to recirculate readers.
- Qualitative signals: Capture on‑page sentiment and intent to learn why visitors stay, leave, or convert.
- Path and drop‑off analysis: Identify where users abandon key journeys (e.g., from blog to signup) and target fixes that move the needle.
- Segment comparison: Contrast behavior by device, source, or page type to prioritize improvements with the highest payoff.
Best for
Content and UX teams that want quick, visual evidence to improve articles and landing pages. Ideal for SMBs and lean teams pairing behavioral insight with GA4 and Search Console to turn "what happened" into "how to fix it" across high‑traffic posts and core templates.
Pricing and trial
Plan details and any trial options are available on the vendor's website. Start by instrumenting a handful of top‑traffic posts and key templates, validate that insights map to measurable KPI gains, then expand coverage across the content library once you see consistent lift.
12. Looker Studio (Google Data Studio)
What it does
Looker Studio is Google's free reporting layer that turns raw metrics into clear, stakeholder‑ready dashboards. Pair it with GA4 and Google Search Console to centralize traffic, engagement, and search visibility so editors, marketers, and execs can answer "what's working?" without digging through multiple tools. For teams comparing content marketing analytics tools, Looker Studio is the simplest way to visualize and share the KPIs that matter. If you're looking for the best content analytics dashboard in 2026, it's hard to beat free, flexible, and natively connected to Google's ecosystem.
Key analytics features
Looker Studio shines when you need flexible, at‑a‑glance reporting that blends search and on‑site performance.
- GA4 + Search Console views: Put sessions, engagement, and conversions next to queries, impressions, and CTR to connect topics with outcomes.
- Custom dashboards and visuals: Build time series, tables, and scorecards around your core content KPIs so everyone tracks the same North Star.
- Filters and date controls: Let users slice by channel, device, or time period to surface trends and spot anomalies fast.
- Funnel and path snapshots: Visualize key steps (e.g., blog → signup) to highlight drop‑offs and prioritize fixes.
- Shareable reports: Give stakeholders live access to dashboards so updates roll in without manual exports.
Best for
Teams standardizing on Google's stack that want painless, shared reporting, marketers and editors who need to put GA4 and Search Console data in one view, plus agencies that must deliver clean, repeatable dashboards clients can understand at a glance.
Pricing and trial
Looker Studio is free. Start by building a lightweight "content performance" dashboard that combines GA4 engagement with Search Console queries/CTR, validate it with your stakeholders, then iterate visuals and filters until it becomes your weekly reporting source of truth.
13. Social Status
What it does
Social Status is a social media analytics and reporting platform that helps content teams see what's working across Facebook, Instagram, TikTok, LinkedIn, X (Twitter), and YouTube, without cobbling together screenshots and exports. It centralizes channel, profile, and campaign performance, automates client‑ready reports, and layers in competitor benchmarking and influencer campaign tracking so you can refine topics, formats, and paid amplification with evidence.
Key analytics features
Social Status earns a spot among content marketing analytics tools by turning social performance into clear next steps for your content and distribution plan.
- Unified social dashboard: Monitor profiles and pages across channels in one place.
- Paid vs. organic breakdowns: Separate and compare results to fine‑tune promotion and budgeting.
- Competitor benchmarking: Track rival profiles and surface best‑performing posts to inform your creative angles.
- Influencer campaign tracking: Read‑only creator connections for clean, permission‑safe performance reporting.
- Customizable report templates: Build branded reports for stakeholders and clients in a few clicks.
- Segmentation and filters: Slice results by profile, campaign, date range, and more to spot patterns fast.
- Ad performance visualization: See how creative and placements contribute to engagement and outcomes.
- Integrations: Facebook Pages, Instagram (Professional, Stories, Reels), Meta Business Suite, Meta Ads Manager, TikTok Profiles, LinkedIn Company Pages, X (Twitter) Profiles, YouTube Channels, and YouTube Shorts.
Best for
Social‑first content teams, brands, and agencies that need consistent, client‑ready reporting and competitive context to guide what to publish, where to promote, and which creators to partner with.
Pricing and trial
A free plan is available. Paid plans start from $6.75/month (billed annually). Choose a tier based on the number of profiles, competitors, and reports your workflow requires; you can validate fit on the free plan, then scale reporting as channels and campaigns grow.
Next steps
You've got a clear view of the analytics stack: search demand, on‑site behavior, editorial performance, reporting, and social. The win now is focus. Pick a few KPIs that matter, wire up the essentials, and let the data tell you what to publish, what to update, and where readers drop off, then iterate weekly.
- Lock your foundation: GA4 + Search Console + a behavior tool (Clarity or Hotjar) + a simple Looker Studio dashboard.
- Add leverage: An SEO suite (Semrush or Ahrefs) for topics/links, plus Parse.ly or Chartbeat for editorial clarity.
- Round out distribution: Social Status for channel reporting and competitor signals.
Choosing the best content analytics platform for your team. There's no single "right" stack, it depends on what decisions you need to make. If your primary question is "which blog posts generate leads and revenue," start with GA4 conversion tracking or HubSpot's CRM‑connected analytics. If you're focused on content performance tracking across search, use Search Console paired with Semrush or Ahrefs to monitor rankings and topic gaps. If you want to understand reader engagement at the page level, scroll depth, rage clicks, dead zones, layer in Clarity or Hotjar. And if your bottleneck is reporting, Looker Studio turns all of that into a content analytics dashboard your stakeholders can actually read.
Connecting tools into a unified analytics and SEO stack. The best tools for content marketing analytics don't live in isolation. GA4 feeds into Looker Studio. Search Console data informs Semrush keyword strategies and RankYak's automated content plans. Clarity heatmaps explain the engagement drop‑offs GA4 flags but can't diagnose. Think of your stack as layers: acquisition data (GSC, Semrush, Ahrefs), on‑site behavior (GA4, Clarity, Hotjar), editorial performance (Parse.ly, Chartbeat), conversion attribution (HubSpot, GA4), and reporting (Looker Studio). Wire them together and you move from scattered metrics to a single narrative about what content works, what needs fixing, and what to create next.
If you want this on autopilot, keywords, briefs, publishing, backlinks, and analytics, start a free 3‑day trial with RankYak and ship one high‑quality, SEO‑optimized article per day without the busywork.

Get Google and ChatGPT traffic on autopilot.
Start today and generate your first article within 15 minutes.
SEO revenue calculator
How much revenue is your website leaving on the table?
Take a quick quiz and see exactly how much organic revenue you're missing out on, along with personalized tips to fix it.
-
4 questions, under 1 minute
-
See traffic and revenue potential
-
No email required
Free · takes 1 minute · no signup needed
Question 1 of 4
Question 2 of 4
Question 3 of 4
Question 4 of 4
Your SEO growth potential
Extra visitors / month
after 6-12 months of consistent publishing
Revenue potential / year
at your niche's avg. conversion rate
Articles needed (12 mo)
to reach this traffic level
ROI with RankYak
at $99/mo ($1,188/year)
To hit that number, you'd need to:
- Build a topical authority strategy for your niche
- Research keywords & map out a full topical cluster
- Write, edit & publish an article every single day
- Build backlinks to the articles you publish
RankYak handles all of this automatically, every day.
* Estimates based on industry averages. Results vary by niche, competition, and domain authority. Most SEO results become visible after 3-6 months of consistent publishing.