Measuring Content Marketing Success: KPIs That Matter

You're publishing content consistently. Your blog has dozens of posts. But when someone asks, "Is it working?", you're not sure what to say. That gap between effort and proof is exactly where measuring content marketing success becomes critical. Without the right metrics, you're flying blind, spending time and budget on content that may or may not move the needle.
The truth is, most businesses track the wrong things, or worse, track nothing at all. Pageviews alone won't tell you if content is driving revenue. Social shares won't tell you if you're attracting the right audience. You need a framework that connects content performance directly to business outcomes like leads, conversions, and ROI.
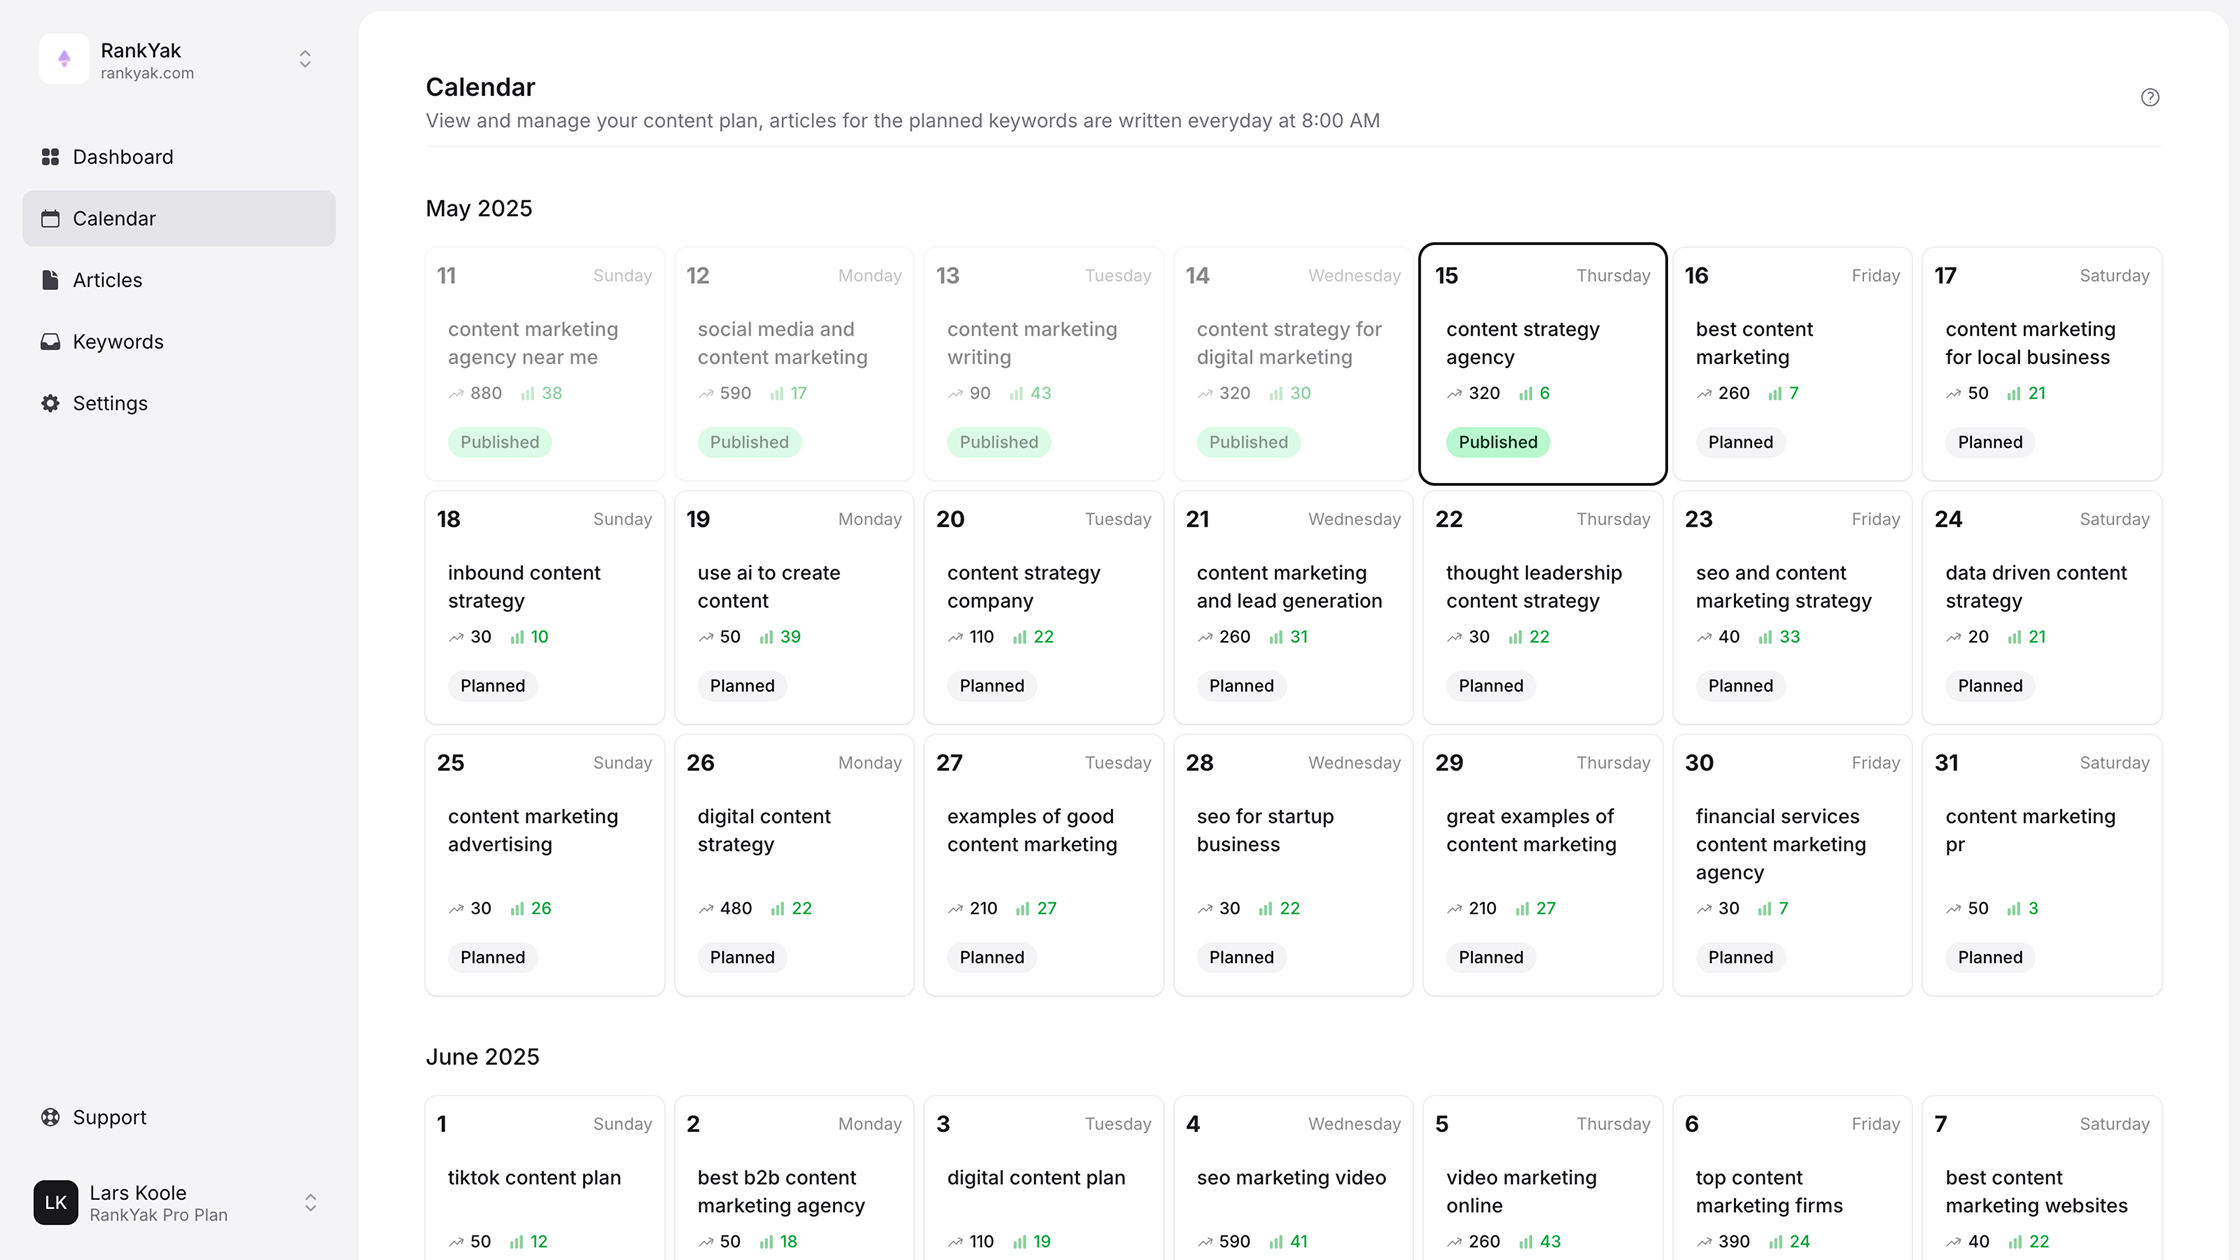
That's a big part of why we built RankYak. Every article our platform creates is designed to rank and drive measurable organic growth, but knowing what to measure is still on you. This guide breaks down the specific KPIs that actually matter, how to track them, and how to use that data to refine your content strategy so every piece you publish earns its keep.
What measuring content marketing success means
Measuring content marketing success means connecting your content output to results that matter for your business, not just confirming that content exists. Most teams default to tracking what's easy to find in a dashboard: total pageviews, social shares, or email open rates. These numbers feel good to report, but they don't tell you whether your content is generating leads, closing revenue, or building your brand's authority in search.
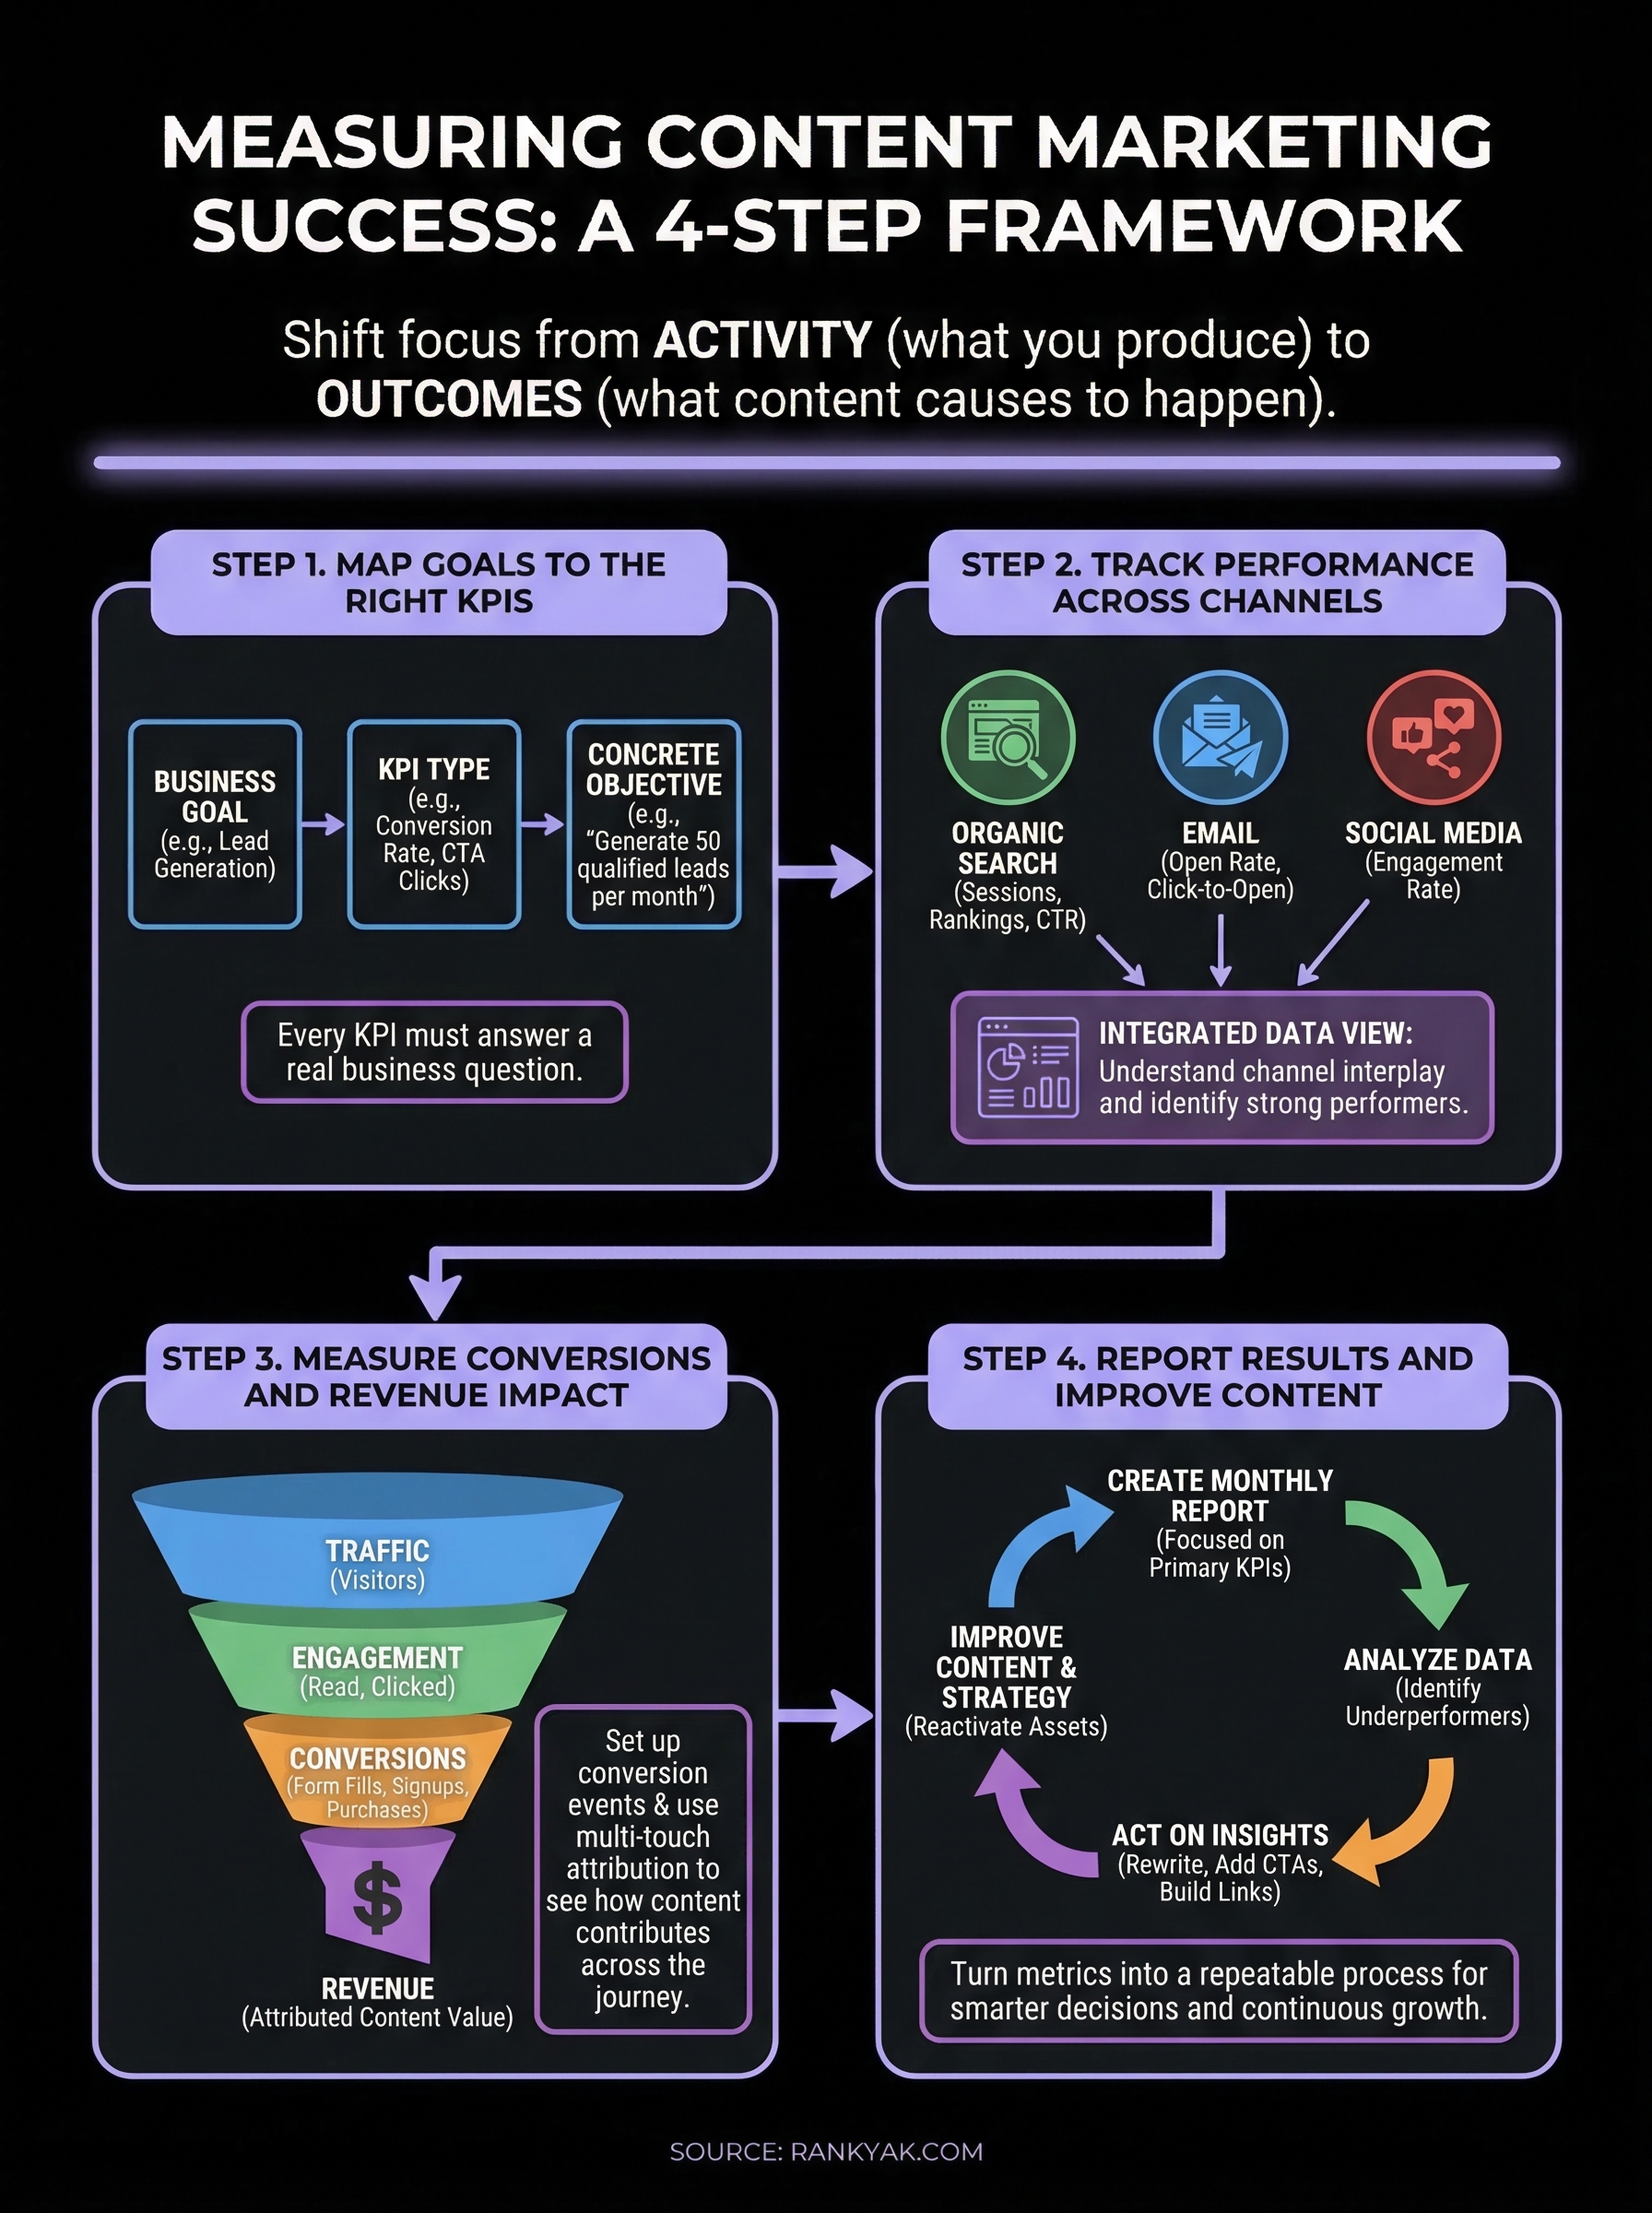
Activity metrics vs. outcome metrics
Activity metrics count what you produce and distribute: the number of posts published, words written, or emails sent. These are useful for tracking consistency, but they have no direct link to business value. Outcome metrics, on the other hand, measure what your content actually causes to happen: organic traffic growth, demo requests from blog readers, or revenue attributed to a content-assisted conversion.
The question isn't "how much content did we publish?" It's "what did that content make happen?"
Shifting your focus from activity to outcomes is the single most important mental shift you can make when building a measurement framework. Teams that track only activity often produce a lot of content without any evidence that it drives business results. Your goal is to build a system where every metric you track answers a real business question.
Why not all metrics are created equal
Your metrics need to match your specific business goals. A SaaS company trying to generate free trials cares deeply about conversion rate from organic landing pages, while an e-commerce brand might prioritize revenue per session or product page traffic sourced from blog content. Picking metrics that don't align with what your business needs means you end up optimizing for numbers that have no bearing on growth.
| Business Goal | Metric Type to Prioritize |
|---|---|
| Brand awareness | Organic impressions, new visitors |
| Lead generation | Form fills, CTA clicks, conversion rate |
| Revenue growth | Revenue influenced, assisted conversions |
| Authority building | Backlinks earned, keyword rankings |
| Audience retention | Return visitor rate, email subscribers |
This distinction is what separates teams that prove content ROI from teams that produce reports nobody acts on. Start by deciding what success looks like for your specific goals, then pick the metrics that confirm whether you're hitting them.
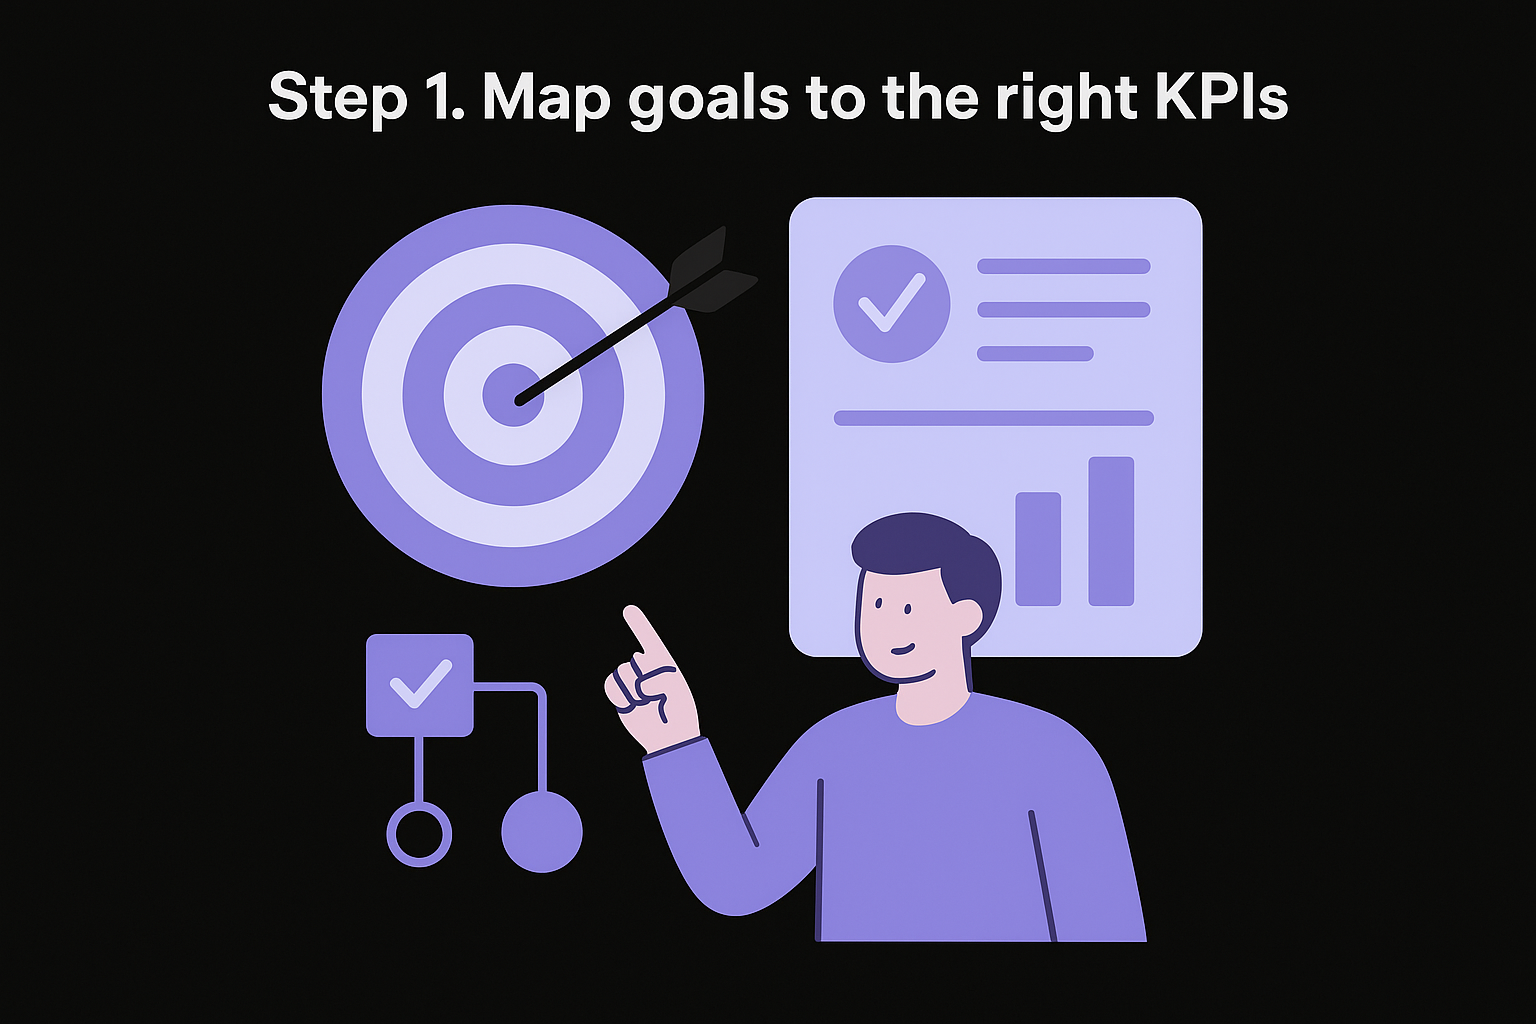
Step 1. Map goals to the right KPIs
Before you pick a single metric, you need to know what your business is trying to accomplish. Measuring content marketing success starts with getting clear on your goals, because a KPI without a goal is just a number with no context. Tie each content goal to a specific business objective first, then assign KPIs that confirm whether you're hitting it.
Start with your business objective
Every content goal should trace back to a concrete business objective like generating leads, growing revenue, or increasing brand visibility. Write that objective down in plain language. For example: "We want blog content to generate 50 qualified leads per month." That single statement tells you exactly which KPIs are worth tracking: form submission rate, organic traffic to conversion pages, and cost per lead.
If you can't connect a metric to a business objective, remove it from your reporting entirely.
Match KPI types to goal categories
Once you have your objective, match it to the right KPI category using this framework:
| Business Objective | Primary KPI | Secondary KPI |
|---|---|---|
| Lead generation | Conversion rate | CTA click-through rate |
| Revenue growth | Content-assisted revenue | Revenue per session |
| Brand awareness | Organic impressions | New visitor rate |
| Retention and loyalty | Return visitor rate | Email subscriber growth |
| Search authority | Keyword ranking positions | Backlinks earned |
Pick one primary KPI and one secondary KPI per objective. Tracking too many metrics at once creates noise and makes it harder to act on what the data is telling you.
Step 2. Track performance across channels
Content lives across multiple channels: your blog, email, social media, and search. Measuring content marketing success requires you to pull data from each channel and understand how they interact, not just how each one performs in isolation. A blog post might get low direct traffic but drive strong email engagement that eventually converts, which you'd miss completely if you only checked one source.
Organic search performance
Your blog's organic performance is the foundation of your content data. Track organic sessions, keyword rankings, and click-through rate (CTR) from Google Search Console to understand how your content performs in search. For each key page, monitor this set of metrics:
| Metric | What It Tells You |
|---|---|
| Organic sessions | How many people find you via search |
| Average keyword position | Where your content ranks |
| Click-through rate (CTR) | How compelling your title and meta description are |
| Impressions | How often Google surfaces your content |
A page with high impressions but low CTR signals a title or meta description problem, not a content quality problem.
Email and social channel metrics
Each distribution channel gives you a different signal about content resonance and audience behavior. For email, track open rate and click-to-open rate to see which topics pull readers in. For social, focus on engagement rate rather than raw likes, since engagement tells you whether your content sparked a real reaction worth measuring.
Compare channel performance side by side each month. This helps you identify which distribution channels are returning strong results and where your time investment needs to shift.
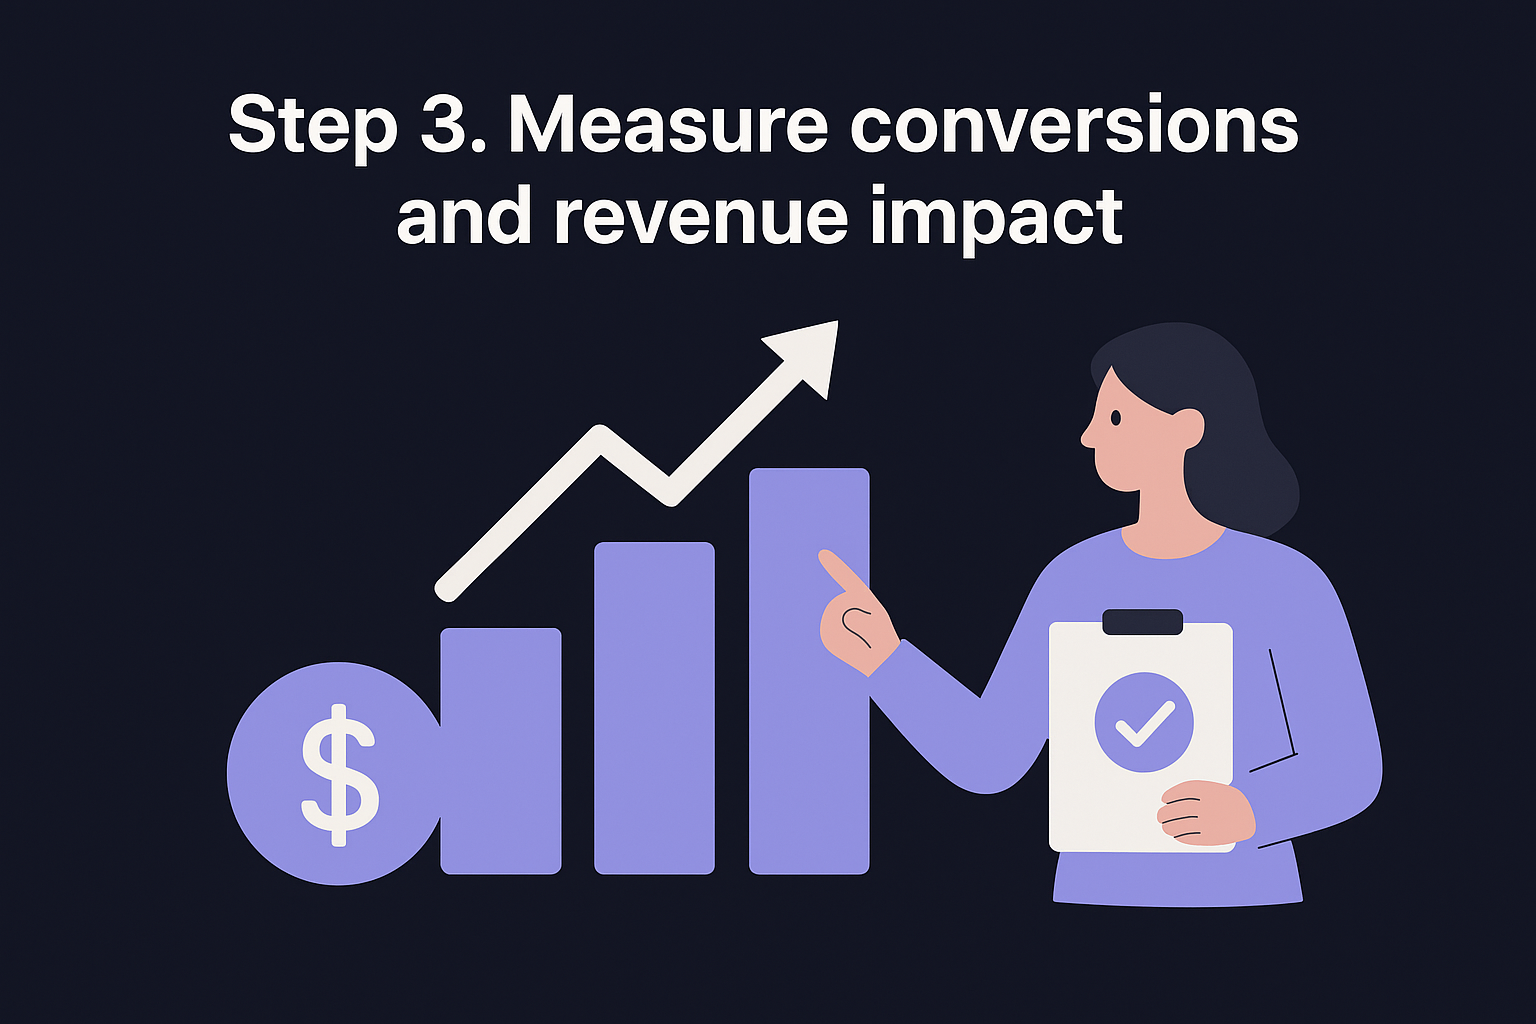
Step 3. Measure conversions and revenue impact
Traffic and engagement tell you whether people find and read your content. Conversions and revenue tell you whether any of it matters to your bottom line. This step is where measuring content marketing success gets concrete: you're connecting specific content pieces to the actions your business actually cares about, like demo signups, purchases, or contact form submissions.
Track conversion events
You need to define what counts as a conversion before you can track one. Set up conversion events in Google Analytics 4 for every action that signals real intent: form submissions, free trial signups, product page clicks from blog posts, and phone call clicks. Once those events fire, you can see exactly which pages drive the most conversions and which ones collect traffic without any business value.
| Conversion Event | What to Track |
|---|---|
| Form submission | Which blog page referred the user |
| Free trial signup | Traffic source and landing page |
| Product page click | Blog post that sent the visitor |
| Purchase | Content-assisted path to checkout |
A high-traffic blog post with zero conversion events is costing you more than it's earning.
Attribute revenue to content
Most buyers don't convert on the first visit. Multi-touch attribution lets you see how content contributes across the full customer journey, not just the final click. In GA4, use the Attribution reports under Advertising to view assisted conversions and identify which content pieces consistently appear in converting paths. This gives you a dollar figure you can attach to your content investment, which makes it far easier to justify budget and scale what works.
Step 4. Report results and improve content
Collecting data is only useful if you act on it regularly. The final step in measuring content marketing success is turning your metrics into a repeatable reporting process that surfaces what's working, what needs fixing, and where to invest next. Without a structured report, even the best data stays buried in dashboards nobody checks.
Build a monthly reporting template
A monthly content report should be short, focused, and tied directly to your business objectives from Step 1. Don't dump every metric into a slide deck. Instead, build a single table that shows performance against your primary KPIs, month over month.
Use this template as your starting point:
| Content Piece | Organic Sessions | Conversions | Keyword Position | Action |
|---|---|---|---|---|
| Blog Post A | 1,240 | 18 | 4 | Scale with related posts |
| Blog Post B | 340 | 0 | 22 | Rewrite CTA, improve title |
| Blog Post C | 90 | 2 | 38 | Update content, build links |
If a post has strong conversions but low traffic, prioritize it for promotion before creating anything new.
Use data to improve underperforming content
Your monthly report will always surface posts with traffic but no conversions and posts with strong rankings but declining clicks. For each underperformer, take one specific action: rewrite the introduction, add a stronger CTA, update outdated statistics, or consolidate thin posts into a single comprehensive piece. Treat every piece of existing content as a live asset you can improve and reactivate, not a sunk cost you ignore after publishing.
Final takeaway
Measuring content marketing success is not about collecting more data. It's about tracking the right metrics that connect directly to your business goals, then using those numbers to make smarter decisions every month. You now have a four-step framework: map goals to KPIs, track performance across channels, measure conversions and revenue, and report results in a way that drives action. That process works whether you publish two posts a month or twenty.
The biggest mistake you can make is publishing content without a measurement plan in place. Every piece of content you create should earn its spot by contributing to organic traffic, leads, or revenue, and your data should confirm it. Start with one goal, one primary KPI, and one monthly review. Build the habit first, then expand it.
If you want content that's built to rank and drive measurable results from day one, try RankYak and put your content on autopilot.

Get Google and ChatGPT traffic on autopilot.
Start today and generate your first article within 15 minutes.
SEO revenue calculator
How much revenue is your website leaving on the table?
Take a quick quiz and see exactly how much organic revenue you're missing out on, along with personalized tips to fix it.
-
4 questions, under 1 minute
-
See traffic and revenue potential
-
No email required
Free · takes 1 minute · no signup needed
Question 1 of 4
Question 2 of 4
Question 3 of 4
Question 4 of 4
Your SEO growth potential
Extra visitors / month
after 6-12 months of consistent publishing
Revenue potential / year
at your niche's avg. conversion rate
Articles needed (12 mo)
to reach this traffic level
ROI with RankYak
at $99/mo ($1,188/year)
To hit that number, you'd need to:
- Build a topical authority strategy for your niche
- Research keywords & map out a full topical cluster
- Write, edit & publish an article every single day
- Build backlinks to the articles you publish
RankYak handles all of this automatically, every day.
* Estimates based on industry averages. Results vary by niche, competition, and domain authority. Most SEO results become visible after 3-6 months of consistent publishing.