Automate SEO Reporting: Step-By-Step Setup That Saves Time

Pulling SEO data from five different dashboards, copying numbers into spreadsheets, and formatting charts every week, it's the kind of work that feels productive but really just eats your time. If you've been handling reports manually, you already know the drill. The good news: you can automate SEO reporting and reclaim those hours for work that actually moves the needle, like strategy, content, and outreach.
This guide walks you through a practical, step-by-step setup for building automated SEO reports, from picking the right tools to connecting your data sources and scheduling delivery. Whether you're reporting for your own site or managing reports for multiple clients, you'll have a repeatable system by the end.
At RankYak, we automate the heavy lifting of SEO, from keyword research to content creation and publishing. But reporting is the piece that ties everything together. Knowing what's working (and what isn't) is how you make smarter decisions and keep your SEO efforts on track. Let's set it up.
What automated SEO reporting is and what to track
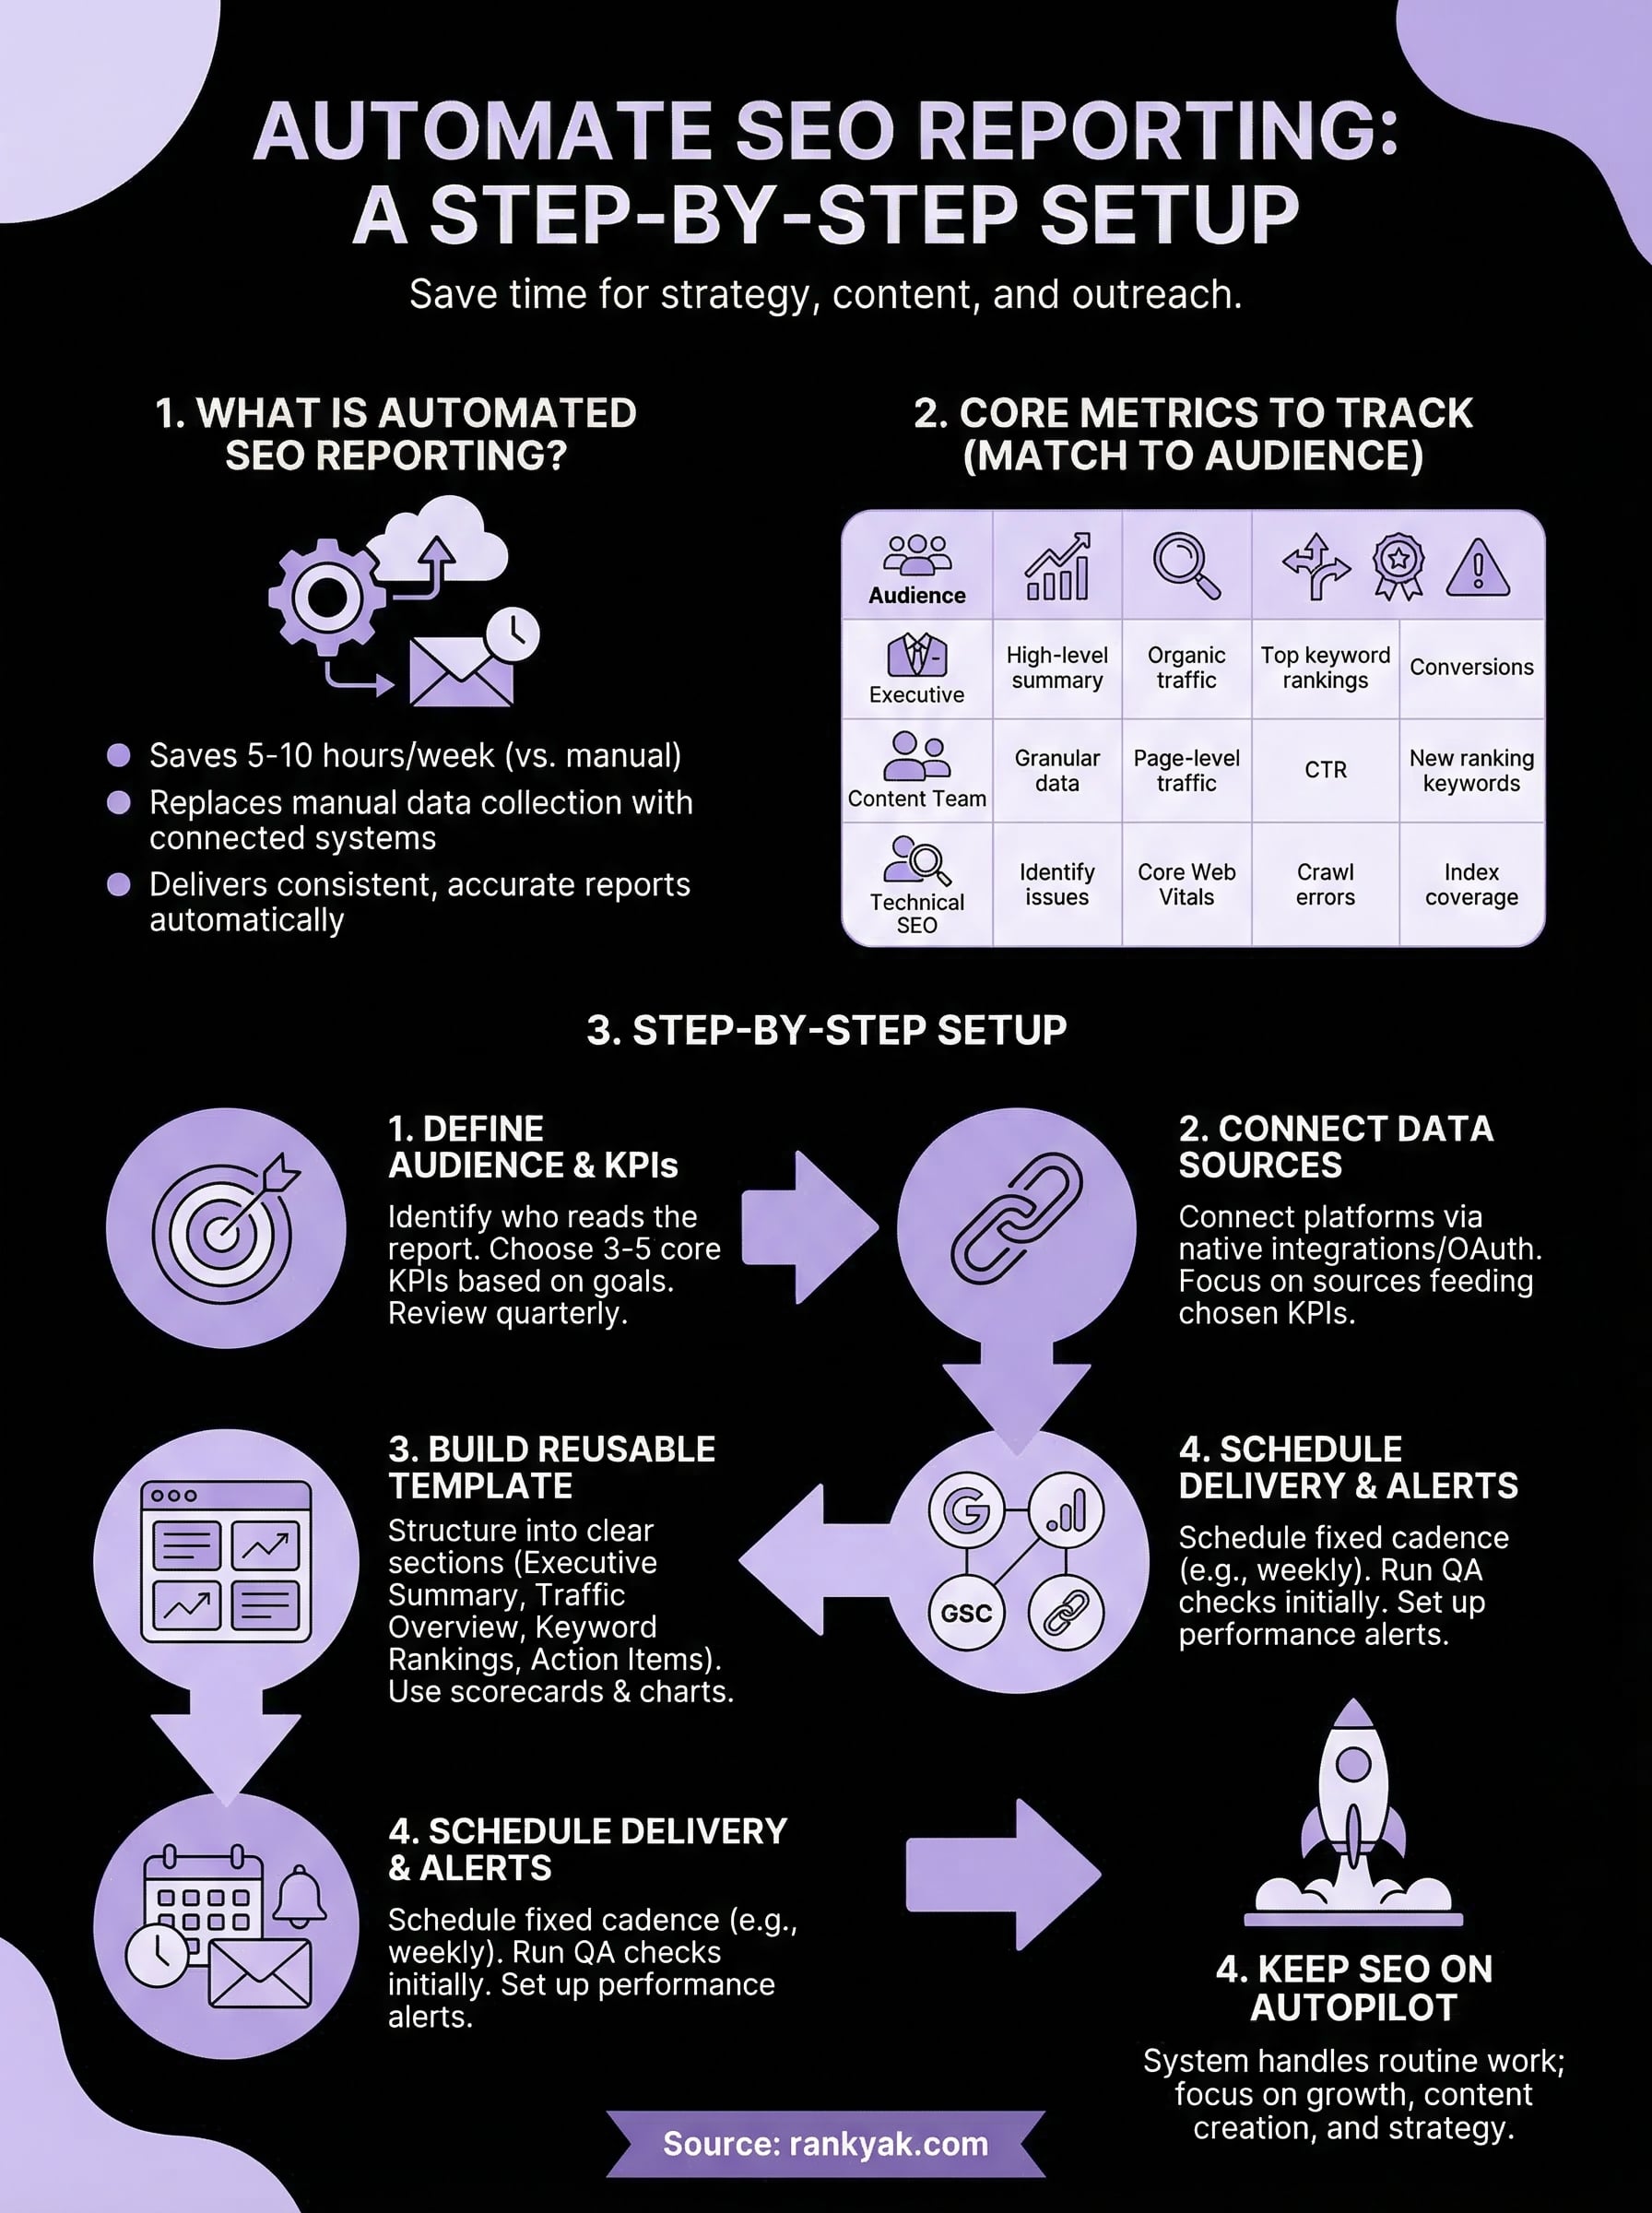
When you automate SEO reporting, you replace manual data collection with a connected system that pulls metrics from your tools, formats the data, and delivers a finished report on a set schedule. Instead of logging into Google Analytics, Search Console, and your rank tracker separately, a connected setup handles that work for you. The result is a consistent, accurate report that lands in your inbox (or your client's inbox) without you touching a spreadsheet each week.
Automated reports are only as good as the data sources and metrics you choose to include, so getting those decisions right upfront is the real work.
Manual vs. automated reports
Manual reporting depends on your time and attention every single cycle. You export data, paste it into a template, update the charts, and format everything before sending. One missed step means an incomplete or inaccurate report. Automated reports pull live or scheduled data directly from connected sources, and once the pipeline is set up, the system handles the rest without reminders.
The practical difference adds up fast. If you're managing multiple sites or clients, manual reporting can easily eat 5-10 hours per week. Automating that workflow cuts it to a quick review before delivery, which frees up time for actual SEO work.
What metrics to include in your SEO reports
Not every metric deserves space in your report. Focus on the ones that reflect actual performance and support real decisions. Here's a solid baseline to start from:
| Metric | Why it matters |
|---|---|
| Organic traffic | Shows whether SEO is driving visits |
| Keyword rankings | Tracks position changes for target terms |
| Click-through rate (CTR) | Reveals title and description effectiveness |
| Impressions | Measures your visibility in search results |
| Backlinks acquired | Indicates authority growth |
| Page-level performance | Identifies top and low-performing content |
| Core Web Vitals | Flags technical issues affecting rankings |
Your report doesn't need every row in this table. Match the metrics to your specific goals and audience, and you'll build something people actually read instead of ignore.
Step 1. Define your report audience and KPIs
Before you connect a single tool or build a single dashboard, get clear on who reads this report and what decisions it needs to support. Skipping this step leads to reports packed with metrics that look impressive but nobody acts on. Your audience shapes everything: the KPIs you include, the level of detail you show, and how you frame the results. Getting this right makes every other step in the setup faster and more focused.
Know who's reading the report
Your report audience usually falls into one of three groups: yourself as the site owner, a client who wants a clear high-level summary, or an internal team that needs granular data to work from. Each group needs a different slice of the same data. A client typically wants to see organic traffic trends and ranking wins they can share with their stakeholders. Your content team needs page-level performance and keyword movement to prioritize what to write next. Defining this upfront keeps you from building one bloated report that tries to serve everyone and ends up helping no one.
Build a separate report for each audience type rather than cramming everything into one.
Pick KPIs that match the goal
Once you know your audience, lock in 3-5 core KPIs before you automate SEO reporting. Fewer metrics make reports faster to read and easier to act on. Use this framework as a starting point:
| Audience | Core KPIs to track |
|---|---|
| Executive or client | Organic traffic, top keyword rankings, conversions |
| Content team | Page-level traffic, CTR, new ranking keywords |
| Technical SEO | Core Web Vitals, crawl errors, index coverage |
Review your chosen KPIs every quarter to confirm they still match your current goals and adjust the list if your priorities shift.
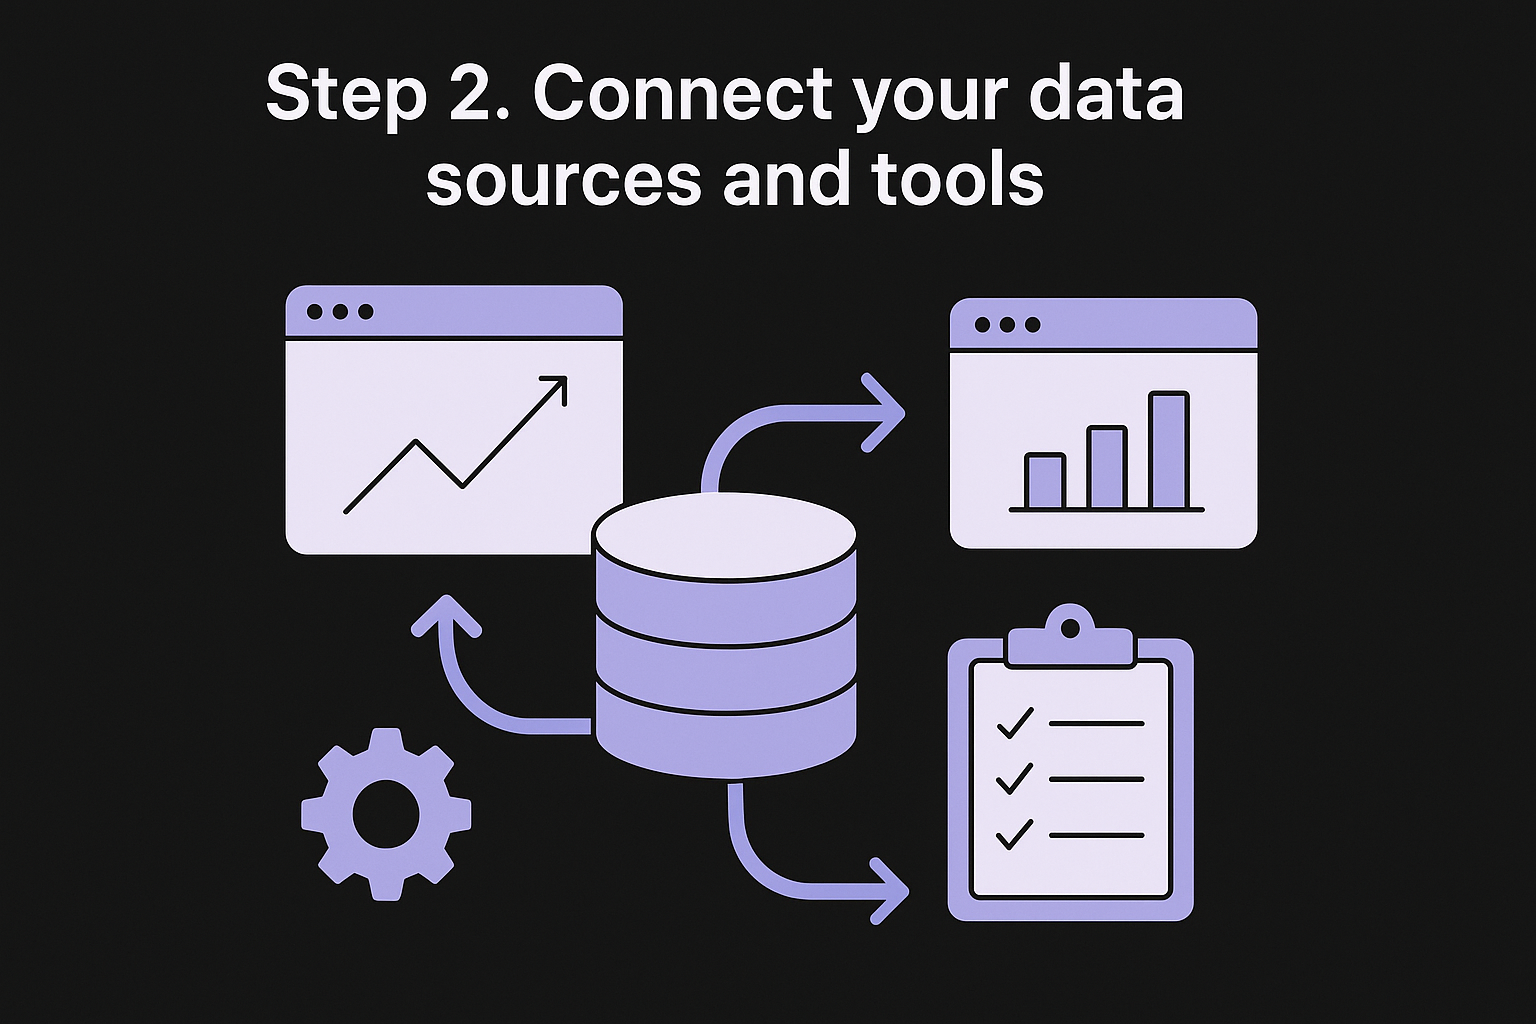
Step 2. Connect your data sources and tools
With your KPIs locked in, the next move is pulling your data into one place. Most SEO data lives across three to four separate platforms, and connecting them is what makes it possible to automate SEO reporting without touching each tool manually every week. Do this step cleanly and everything downstream becomes much easier.
The core sources to connect
Start with the platforms that hold the metrics you defined in Step 1. For most sites, that means four sources:
- Google Search Console: Impressions, clicks, CTR, and keyword rankings
- Google Analytics 4: Organic sessions, conversions, and page-level traffic
- Your rank tracker: Daily or weekly keyword position data
- Your backlink tool: New links acquired and domain authority trends
Connect only the sources that feed your chosen KPIs. Adding extra integrations just to have more data creates noise, not insight.
How to connect them
Most reporting tools connect to these sources through native integrations or OAuth authentication, so you rarely need to touch an API directly. In Looker Studio, for example, you click "Add data," select the Google Search Console connector, and authorize access to your property. The same process applies to GA4: add the connector, pick your account and property, and your metrics are live within a few minutes. For rank trackers and backlink tools without native connectors, use a Google Sheets export combined with a scheduled refresh to keep the data current.
Step 3. Build one reusable report template
A reusable template is what turns a one-time setup into a repeatable system. Once you build it correctly, every report cycle becomes a refresh rather than a rebuild. The goal is a single template that pulls your connected data automatically, formats it consistently, and requires minimal manual input before it goes out the door.
Structure your template around sections
Organize your template into clear, distinct sections so readers can jump to what matters to them. Each section should map directly to the KPIs you defined in Step 1. A solid structure keeps the report scannable and prevents data from getting buried.
A report nobody reads is the same as no report at all, so structure for skimmability from the start.
Use these four sections as your baseline:
- Executive summary: 3-5 sentences on overall performance and the biggest win or concern
- Traffic overview: Organic sessions trend, top landing pages, and week-over-week or month-over-month change
- Keyword rankings: Position changes for your core target terms and any new keywords entering the top 10
- Action items: 2-3 specific next steps based on what the data shows
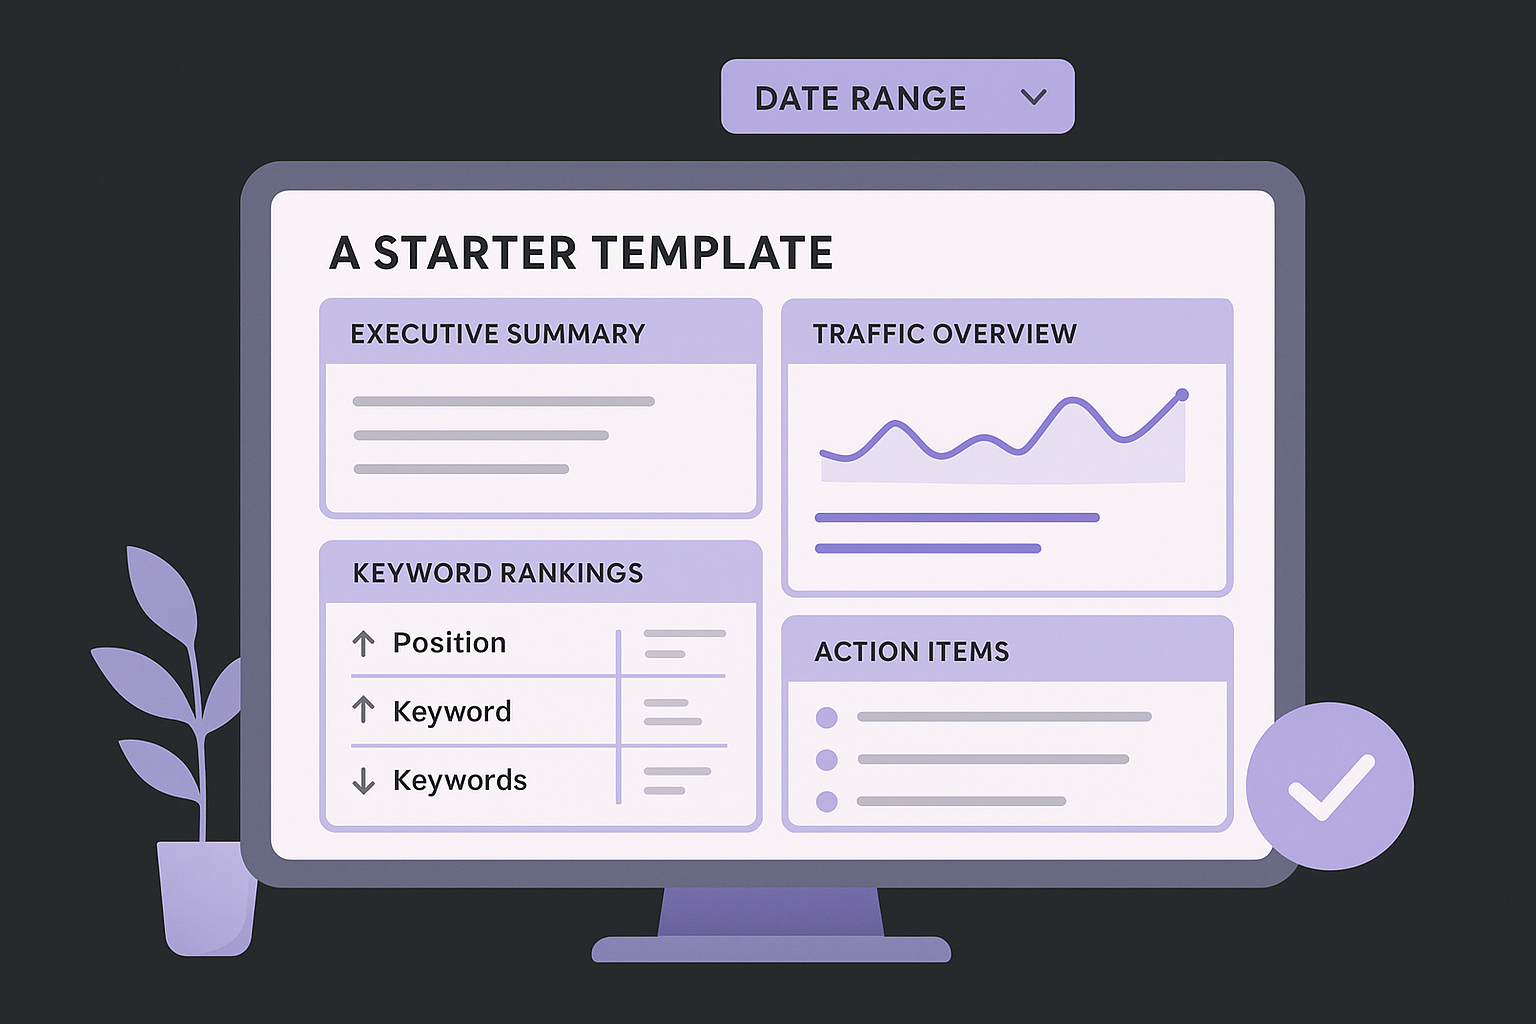
A starter template layout
When you automate SEO reporting in Looker Studio, build each section as a separate page in your report. This keeps the layout clean and lets you update one section without disrupting the others. Use scorecards for single metrics and time-series charts for trend data. Lock the date range controls at the top so every viewer sees the same period automatically.
Step 4. Schedule delivery, QA, and alerts
Your report template is built and your data sources are connected. Now you need to schedule delivery so the report goes out automatically, run a quick QA check to catch data issues before it reaches anyone's inbox, and set up alerts for the metric changes that need immediate attention. This step is what turns a manual build into a system that lets you truly automate SEO reporting without babysitting it every cycle.
Set your delivery schedule
In Looker Studio, use the scheduled email delivery feature to send your report on a fixed cadence. Go to "Share," then "Schedule delivery," add your recipients, set the frequency, and choose the date range the report covers. Weekly delivery on Monday mornings works well for most SEO reports because it gives stakeholders a clear view of the prior week before the new one gets underway. Your report lands in the right inbox without you touching it each cycle.
Match your delivery frequency to how often your data meaningfully changes. Weekly works for most SEO reports; monthly works better for executive summaries.
Add QA checks and data alerts
Before you fully trust the pipeline, run a short QA checklist for the first four weeks to verify your data pulls correctly. Confirm that traffic numbers match what you see directly in GA4, check that keyword positions align with your rank tracker, and make sure date ranges are consistent across every section.
For ongoing monitoring, set up Google Search Console performance alerts to flag significant drops in clicks or impressions between report cycles. This catches critical changes without waiting for your next scheduled delivery.
Keep SEO reporting on autopilot
Setting up automated SEO reporting is a one-time investment that pays back every week. Once your data sources are connected, your template is built, and your delivery schedule is running, the system handles the routine work for you. You spend your time reviewing results and making decisions, not pulling numbers from dashboards.
Reporting tells you what's working, but it only helps if your underlying SEO work is consistent. That means publishing optimized content regularly, building backlinks, and targeting the right keywords before you ever hit publish. If you're still doing that part manually, the reporting wins you just built don't have much to measure.
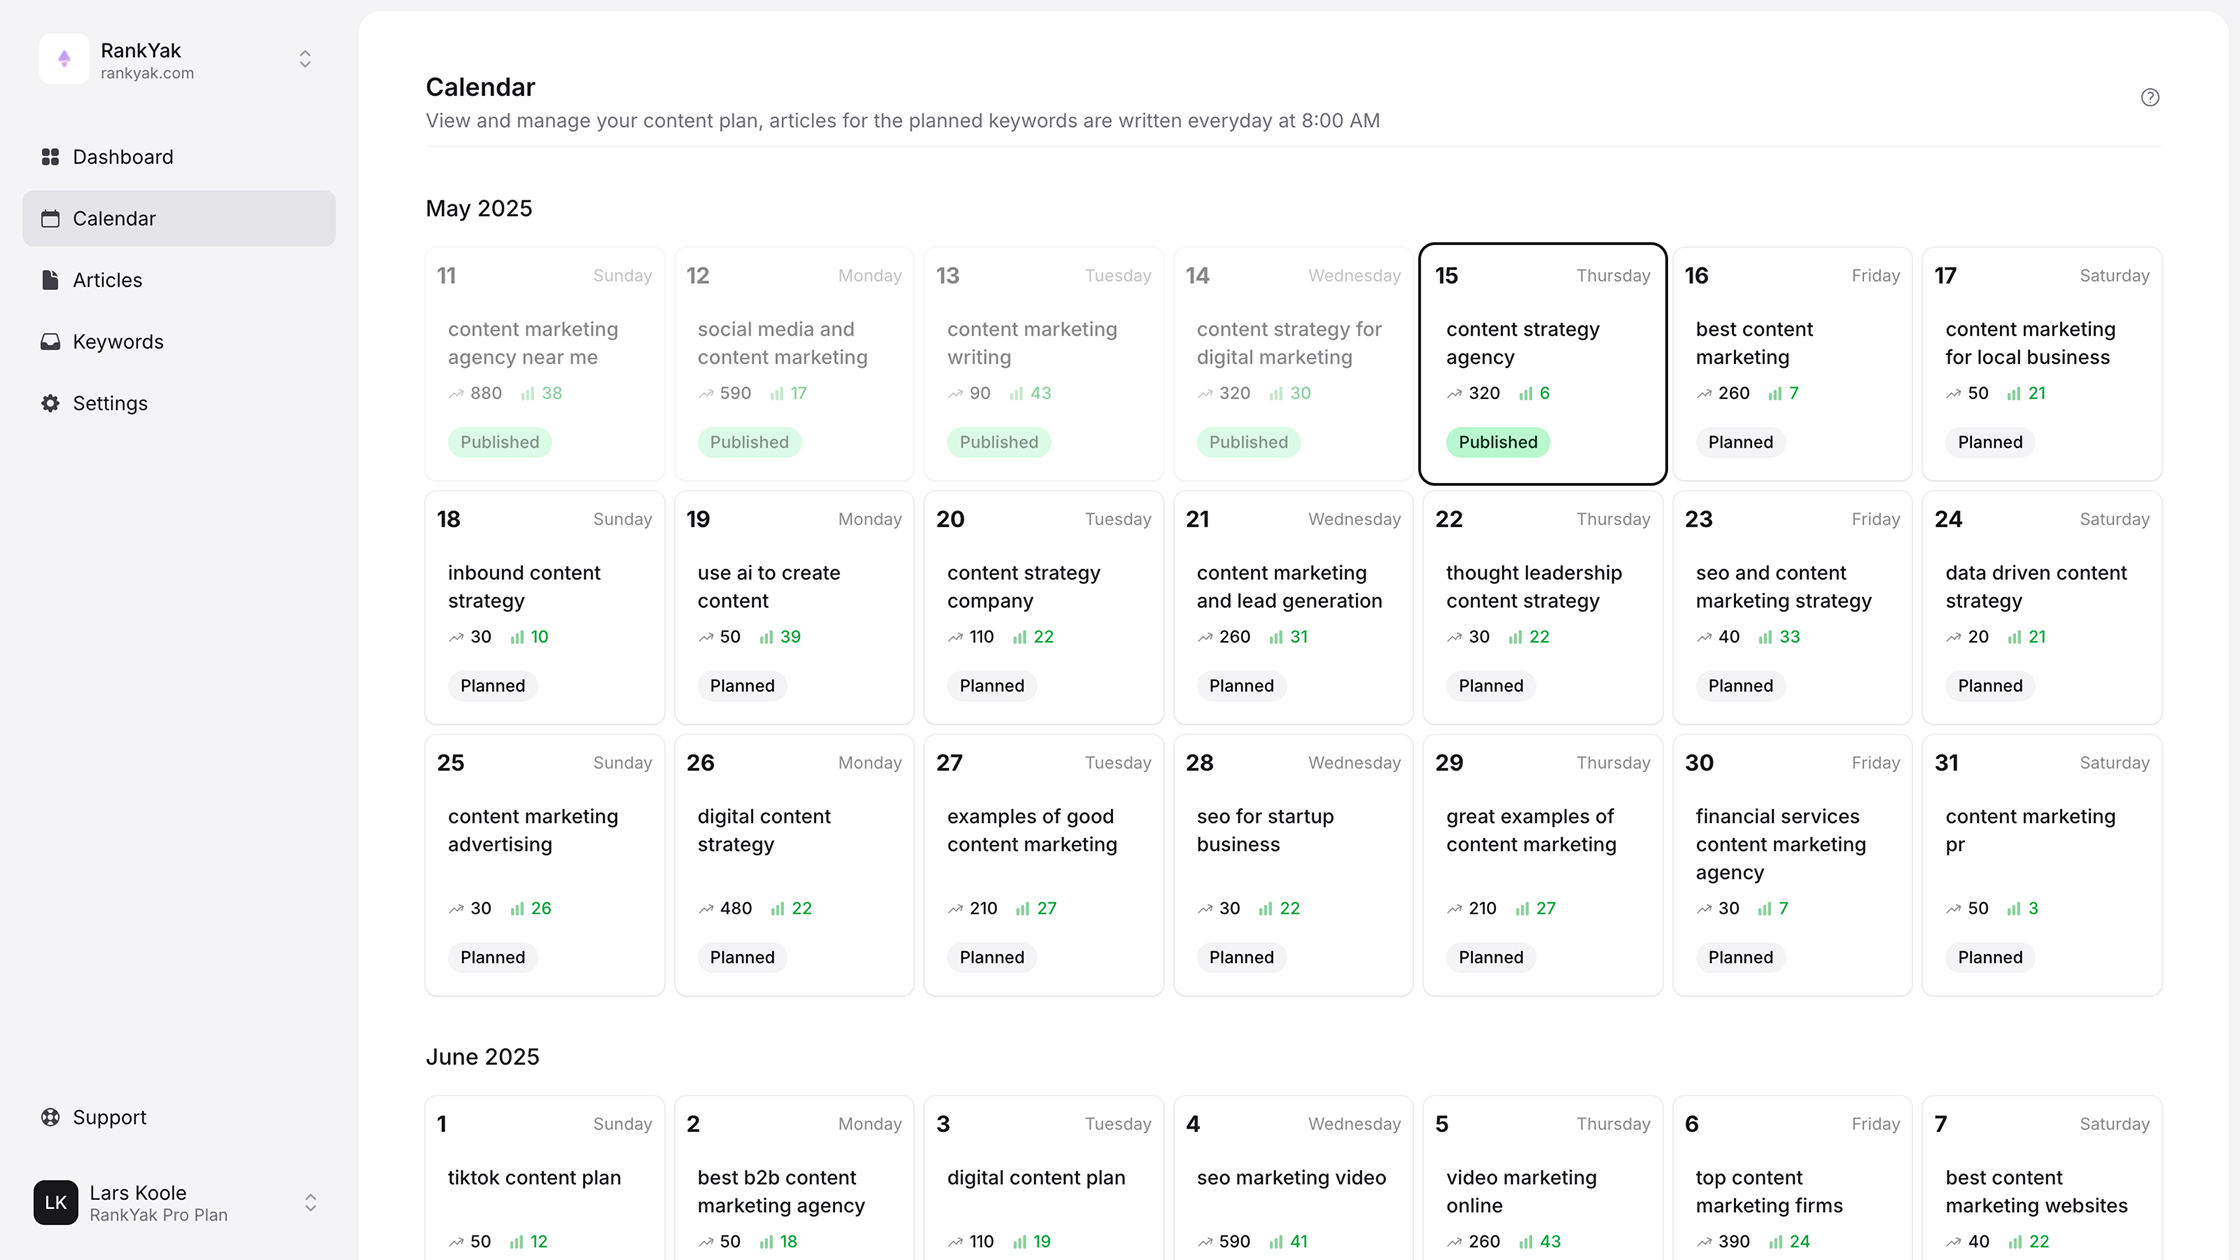
RankYak automates the full SEO content cycle, from keyword discovery and article creation to daily publishing across your site. Pair that with the reporting system you just set up, and you have a complete, hands-off SEO operation running in the background while you focus on growth.

Get Google and ChatGPT traffic on autopilot.
Start today and generate your first article within 15 minutes.
SEO revenue calculator
How much revenue is your website leaving on the table?
Take a quick quiz and see exactly how much organic revenue you're missing out on, along with personalized tips to fix it.
-
4 questions, under 1 minute
-
See traffic and revenue potential
-
No email required
Free · takes 1 minute · no signup needed
Question 1 of 4
Question 2 of 4
Question 3 of 4
Question 4 of 4
Your SEO growth potential
Extra visitors / month
after 6-12 months of consistent publishing
Revenue potential / year
at your niche's avg. conversion rate
Articles needed (12 mo)
to reach this traffic level
ROI with RankYak
at $99/mo ($1,188/year)
To hit that number, you'd need to:
- Build a topical authority strategy for your niche
- Research keywords & map out a full topical cluster
- Write, edit & publish an article every single day
- Build backlinks to the articles you publish
RankYak handles all of this automatically, every day.
* Estimates based on industry averages. Results vary by niche, competition, and domain authority. Most SEO results become visible after 3-6 months of consistent publishing.