Google Analytics For SEO: GA4 Setup And Reporting Guide

Publishing SEO content consistently is only half the equation. Without Google Analytics for SEO, you're essentially flying blind, creating articles, targeting keywords, and building backlinks with no clear picture of what's actually driving results. GA4 changed the game when it replaced Universal Analytics, and many site owners are still catching up to how its new data model works for organic search tracking.
The good news: once configured correctly, GA4 gives you granular insight into organic traffic, user behavior, and conversion paths that directly inform your SEO strategy. It tells you which pages pull their weight and which ones need attention, the kind of data-driven clarity that turns guesswork into action.
This guide walks you through setting up GA4 for SEO from scratch, building custom reports, and extracting the metrics that matter most. Whether you're managing SEO manually or using an automation platform like RankYak to handle content creation and publishing, knowing how to read and act on your analytics is what separates sites that grow from sites that plateau. Let's get into the setup, the reports, and the insights that'll sharpen your SEO workflow.
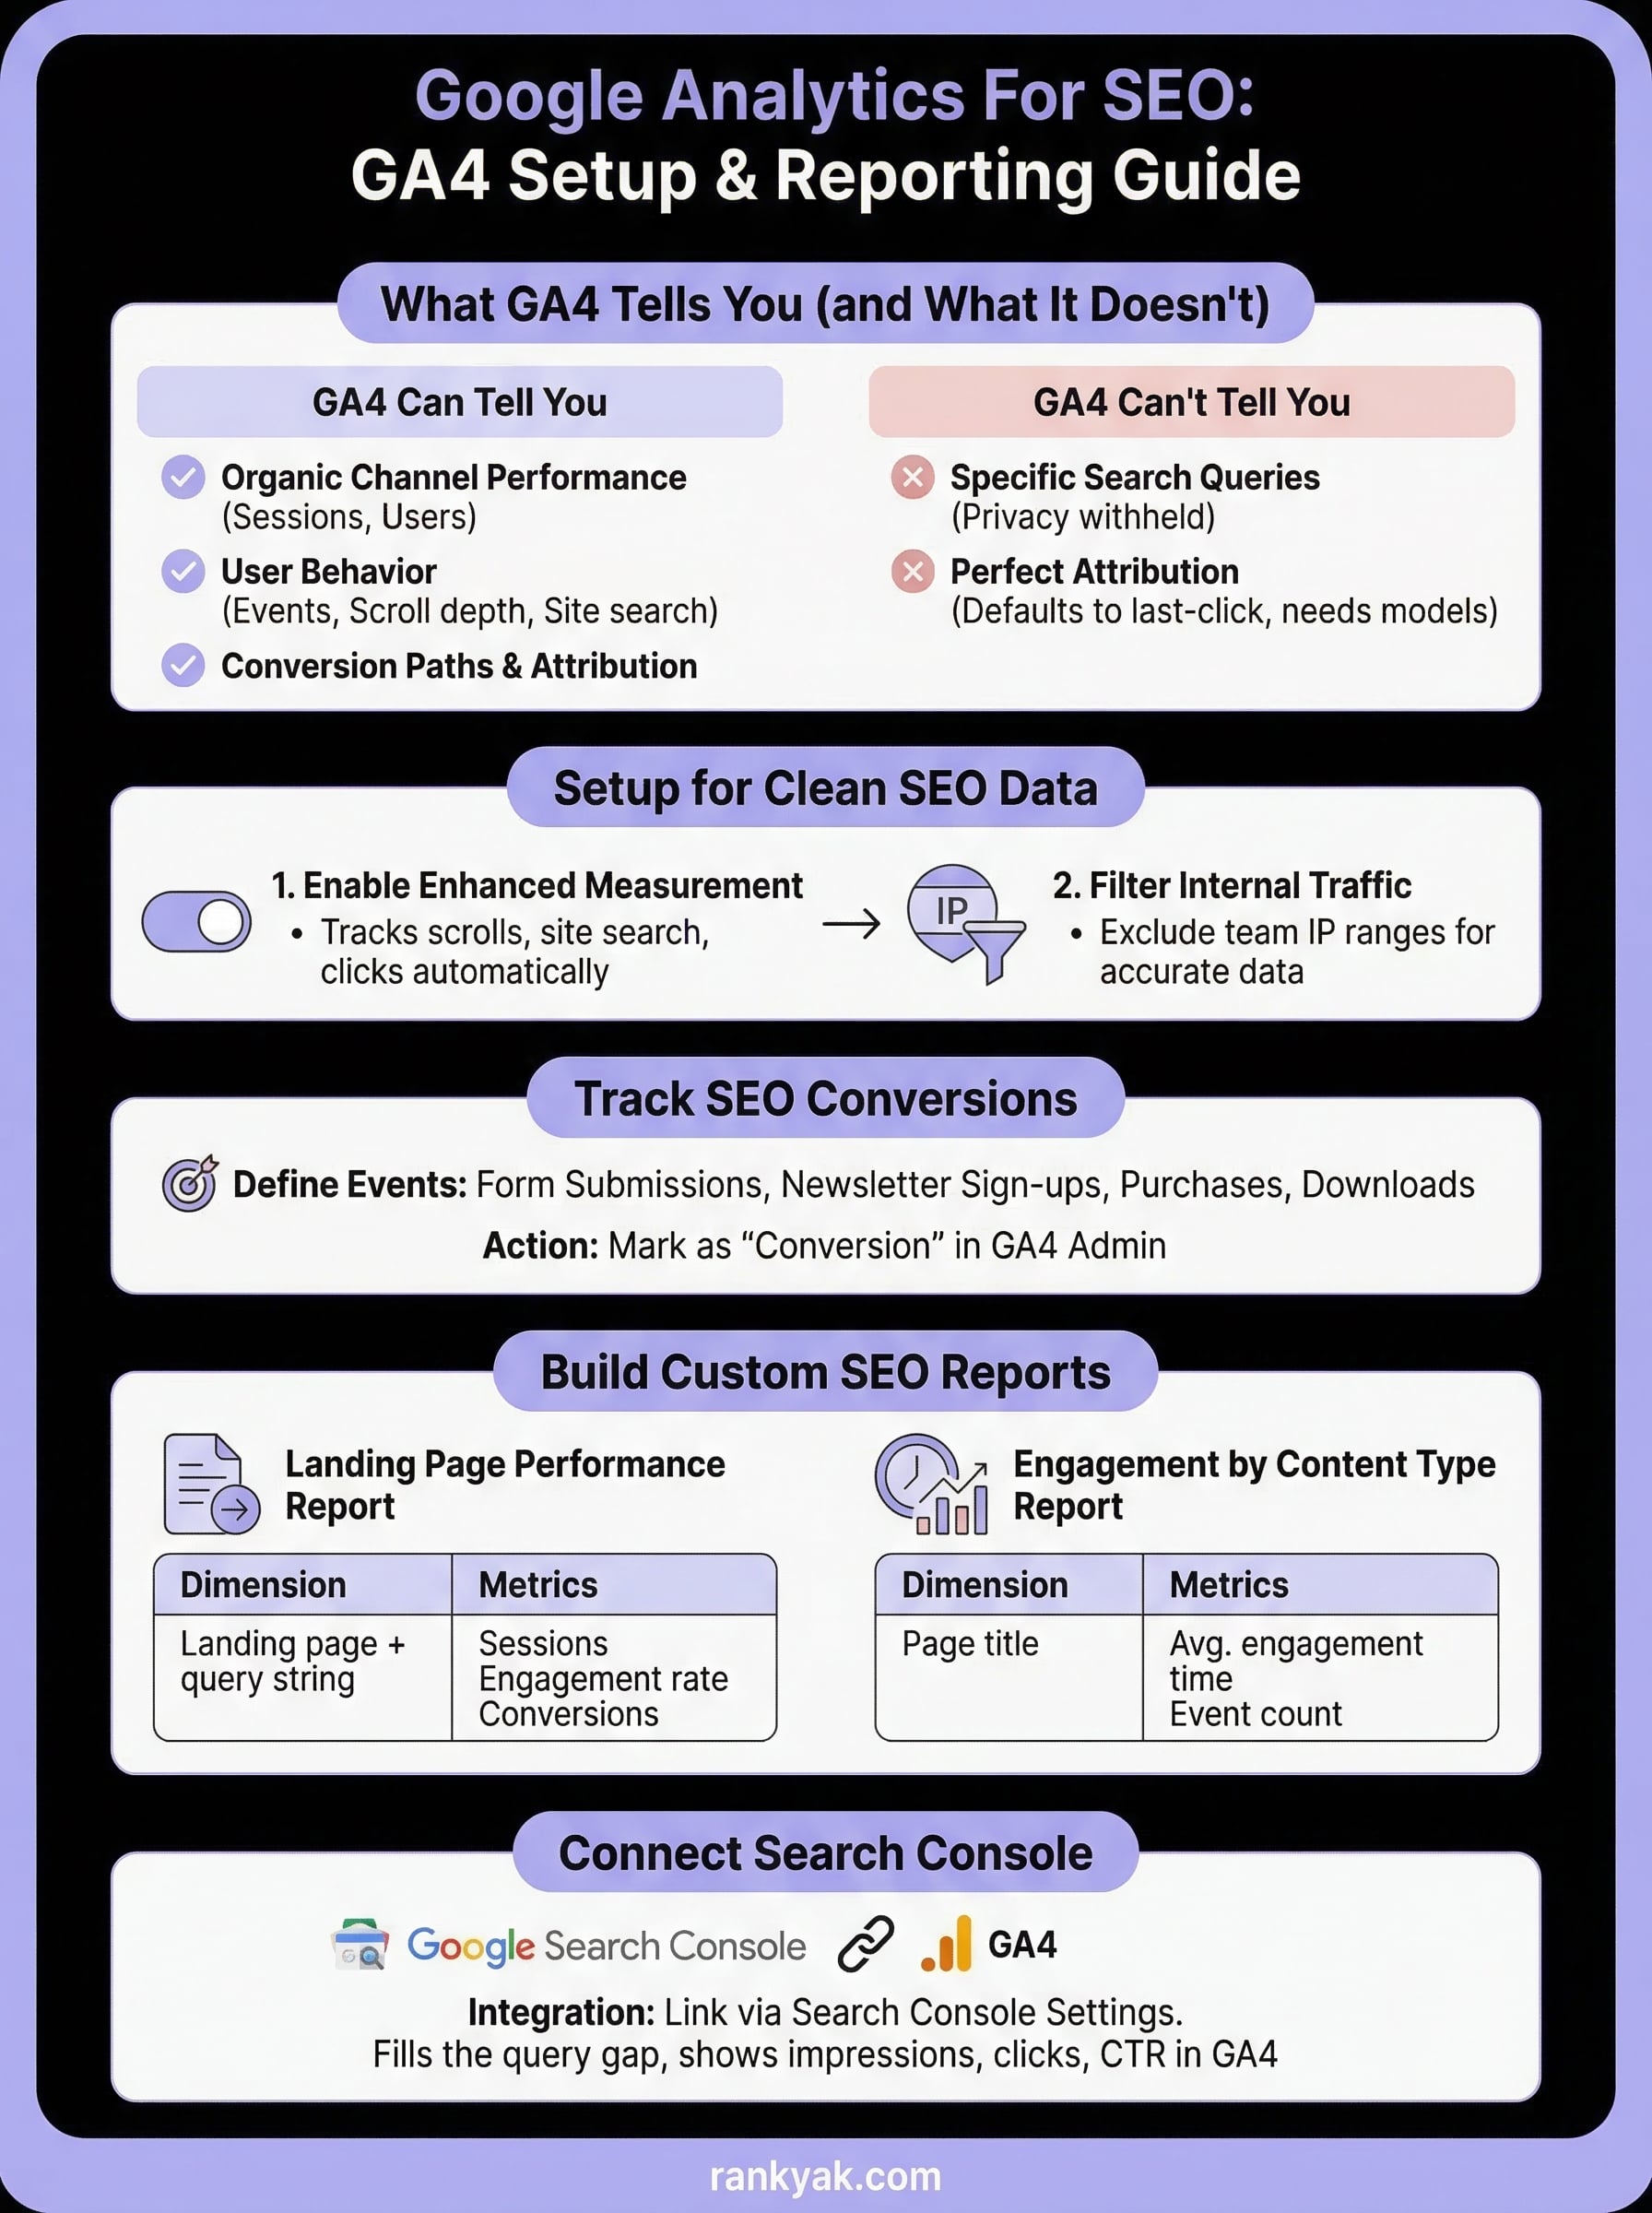
What GA4 can and can't tell you about SEO
GA4 tracks user behavior across your site using an event-based data model, which is a significant shift from the session-based approach of Universal Analytics. When you use google analytics for seo, you're working with a system that monitors how organic visitors find your pages, what they do after landing, and whether they complete the actions you care about. Understanding the boundaries of that system upfront saves you from chasing the wrong numbers.
What GA4 shows you about organic traffic
GA4 gives you solid visibility into organic channel performance once you configure it correctly. You can see which landing pages attract the most organic sessions, how long those users stay, and what events they trigger during a visit. The Acquisition reports break traffic down by channel, so organic search sits alongside direct, referral, and paid traffic, giving you a clear comparison of how each source contributes to your goals.
GA4's event-based model means every scroll, click, and form submission can become a trackable data point, giving you far more behavioral context than raw session counts alone.
Beyond basic traffic numbers, you can segment organic users and build Exploration reports that show their paths through your site, which pages they exit from, and which content drives the most conversions. That level of detail helps you pinpoint content that performs well beyond just attracting clicks, so you can double down on what actually works.
Where GA4 hits its limits
GA4 does not show you which search queries brought users to your site. Google withholds that keyword data for privacy reasons, so the keyword dimension inside GA4 is largely absent. This is the biggest gap for SEO work, and it's why connecting Google Search Console (covered in Step 4) is non-negotiable if you want query-level insights alongside your behavioral data.
Attribution accuracy is another area where GA4 creates friction for SEO analysis. A user might discover your site through organic search, leave, and return directly days later to convert. GA4's default last-click attribution credits the direct visit, not the organic one that started the journey. Checking multiple attribution models in the Advertising section gives you a more accurate picture of how organic search contributes to conversions over longer timeframes. These limitations don't make GA4 less useful; they just mean you need to pair it with the right tools and read the data with those gaps clearly in mind.
Step 1. Set up GA4 for clean SEO data
Getting clean data from the start prevents you from making SEO decisions based on inflated session counts or polluted organic metrics. Before you build any reports, a few configuration steps inside GA4 will ensure the data you analyze reflects real user behavior from actual visitors, not your own team, bots, or broken tag implementations.
Enable enhanced measurement
GA4's enhanced measurement feature automatically tracks scroll depth, outbound clicks, site search, and file downloads without requiring custom event code. You enable it inside Admin > Data Streams > your web stream by toggling the enhanced measurement switch to on.
Scroll depth data tells you whether organic visitors are actually reading your content or leaving after the first few lines, a behavioral signal that raw session counts never reveal.
For SEO work, scroll depth and site search tracking are the most actionable signals in this feature. If organic visitors consistently leave a page after a short scroll, you have direct evidence that the content structure or depth needs improvement before you push for higher rankings.
Filter out internal traffic
Your own site visits inflate organic session data and distort your real performance picture. To fix this, navigate to Admin > Data Streams > Configure Tag Settings > Define Internal Traffic, add your IP address ranges, then set up an exclusion filter under Admin > Data Filters. Once active, GA4 stops recording your team's visits as organic sessions.
Follow this path to configure it:
- Admin > Data Streams > your stream > Configure Tag Settings
- Define Internal Traffic > enter your IP range
- Admin > Data Filters > Create Filter
- Set filter state to Active
This foundation makes your google analytics for seo reporting trustworthy before you build any custom reports or dashboards.
Step 2. Track SEO conversions that matter
Organic traffic counts mean nothing if you can't tie them to actual business outcomes. GA4 treats conversions as marked events, so you decide which user actions count as a conversion rather than having the platform assume. For google analytics for seo, this step separates useful reporting from vanity metrics.
Define your SEO conversion events
Before marking anything as a conversion, decide which actions signal that an organic visitor achieved a meaningful goal on your site. These vary by business type, but the most common SEO-relevant conversions include:
- Lead form submissions from blog post CTAs or landing pages
- Email newsletter sign-ups driven by organic content
- Product page purchases originating from organic search sessions
- Content downloads like guides or templates linked in articles
- Demo or trial requests from visitors who found you through search
Match your conversions to the business goal, not the GA4 defaults, because the right conversion list is the only way to evaluate whether your SEO content is doing its actual job.
Mark events as conversions in GA4
Once you identify which events matter, marking them in GA4 takes under a minute. Navigate to Admin > Events and locate the event you want to track as a conversion. Toggle the Mark as conversion switch to on. GA4 then counts each time that event fires during an organic session as a conversion in your reports.
If the event doesn't appear in the list yet because no user has triggered it, go to Admin > Conversions > New Conversion Event and type the exact event name. GA4 will start recording it as a conversion once it fires. Use consistent naming conventions like form_submit_contact or trial_start to keep your conversion list readable as it grows.
Step 3. Build the GA4 SEO reports you'll use weekly
Default GA4 reports are broad by design. For google analytics for seo, you need focused views that surface organic-specific performance data without digging through unrelated channels every time. The two custom Exploration reports below give you a repeatable weekly workflow that actually informs content decisions.
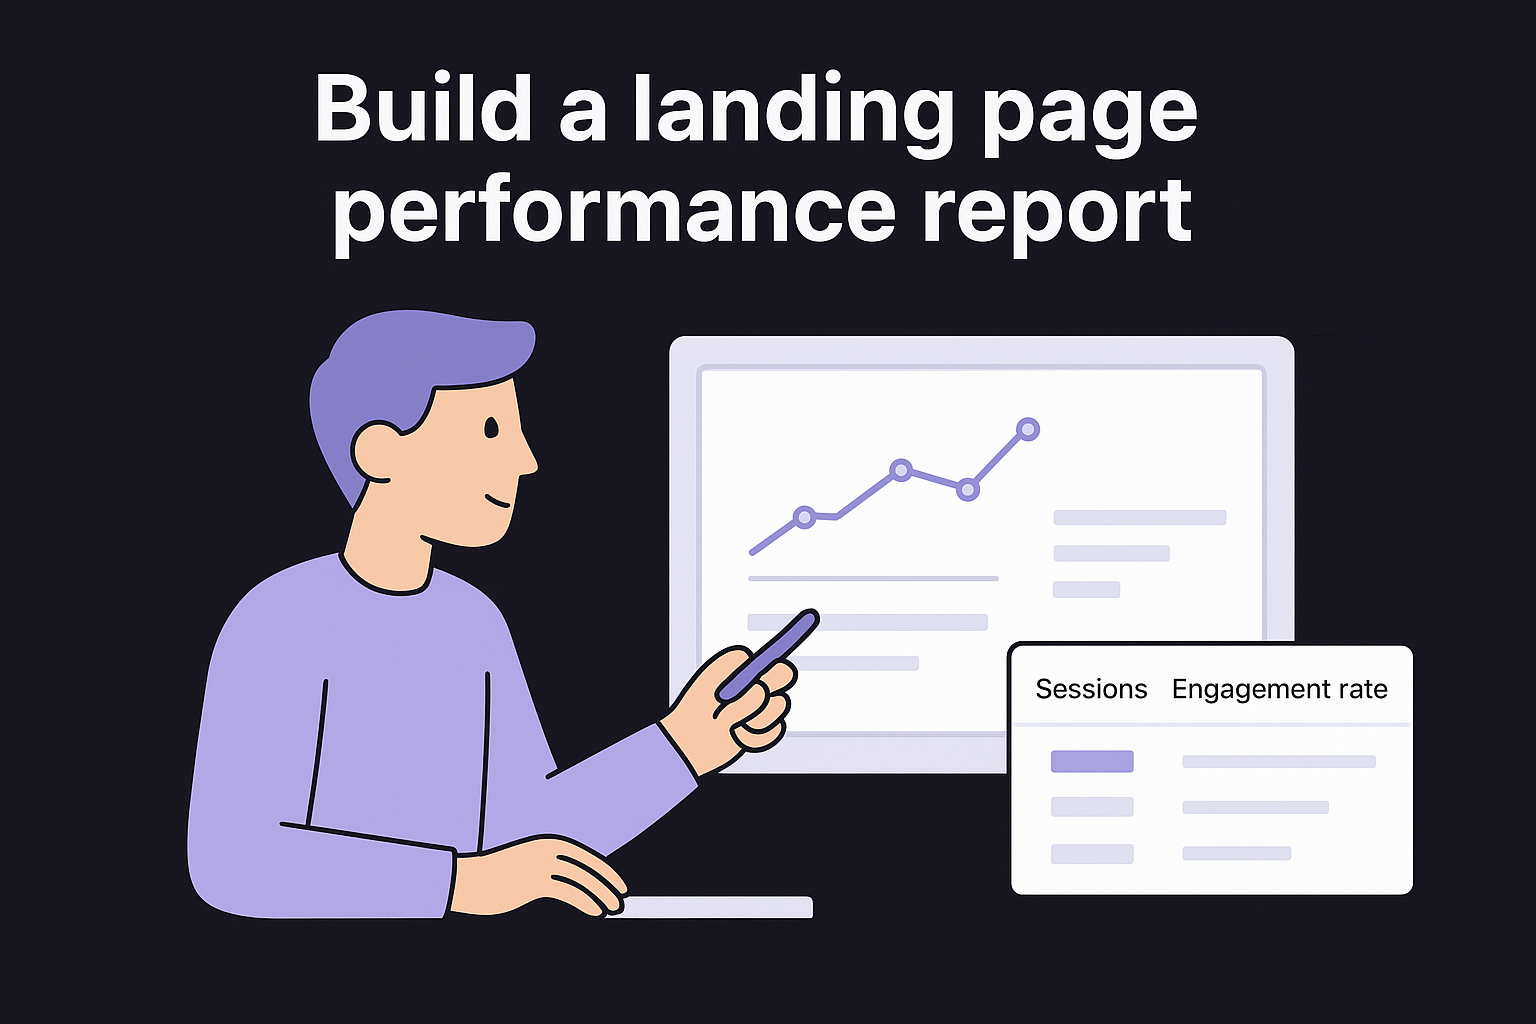
Build a landing page performance report
This report shows you which pages attract organic traffic and how those visitors behave after landing. To build it, open Explore > Blank Exploration, then configure the dimensions and metrics as follows:
| Setting | Value |
|---|---|
| Technique | Free Form |
| Dimension | Landing page + query string |
| Segment | Organic Traffic (add via Segments panel) |
| Metrics | Sessions, Engagement rate, Conversions |
| Rows | Landing page dimension |
This single report tells you which organic landing pages convert and which ones lose visitors fast, making it your most actionable weekly check-in inside GA4.
Once built, sort by Sessions descending to identify your top organic entry points, then scan the Engagement rate column to spot pages where visitors leave without interacting. Pages with high traffic but low engagement rates are your clearest content improvement targets.
Track engagement by organic content type
Create a second Exploration using the same organic traffic segment, but swap the dimension to Page title and screen class. Add Average engagement time per session and Event count as metrics alongside session data. This report groups content by title, so you can compare how blog posts, product pages, and landing pages hold organic visitor attention relative to each other.
Sort by Average engagement time descending and look for patterns in your highest-performing titles. Strong engagement across similar content formats signals where to publish more, giving your content strategy a concrete data foundation.
Step 4. Connect Search Console for query insights
GA4 alone cannot show you which search queries drive organic traffic to your site. Connecting Google Search Console fills that gap by pulling query data, impressions, click-through rates, and average position directly into your GA4 interface. This integration is the most important step you can take to build complete google analytics for seo reporting without jumping between separate platforms every time you need query-level context.
Link GA4 to Search Console
The connection happens inside Search Console, not GA4. Follow these steps to complete it:
- Open Search Console and select your property
- Navigate to Settings > Associations
- Click Associate a property and choose your GA4 property from the list
- Confirm the association
Once linked, GA4 adds a Search Console collection to your Reports section within a few hours. This collection includes two pre-built reports: the Queries report and the Google organic search traffic report, both ready to use without any additional configuration.
The Queries report inside GA4 shows you the exact search terms bringing visitors to your site, data that no amount of GA4 configuration alone can produce.
Read the Search Console reports in GA4
Open the Queries report under Reports > Search Console. You'll see each query alongside its clicks, impressions, CTR, and average position. Sort by impressions descending to find queries where your pages show up frequently but collect few clicks, which is a direct signal that your title tag or meta description needs a rewrite.
Switch to the Google organic search traffic report to layer engagement metrics on top of Search Console data. Pages that rank well but show weak average engagement time tell you the content isn't matching search intent, and that mismatch is a stronger optimization priority than chasing a higher position alone.
Next steps to keep improving
You now have a complete system for using google analytics for seo: clean data setup, conversion tracking, custom reports, and Search Console integration. The next move is to review these reports on a fixed weekly schedule rather than checking them sporadically, because patterns only become visible when you look at data consistently over time.
Start by acting on the clearest signals first. Pages with high impressions but low CTR need better title tags and meta descriptions. Pages with strong organic traffic but weak engagement need content improvements. Pick one fix per week and measure the result the following month against your baseline numbers.
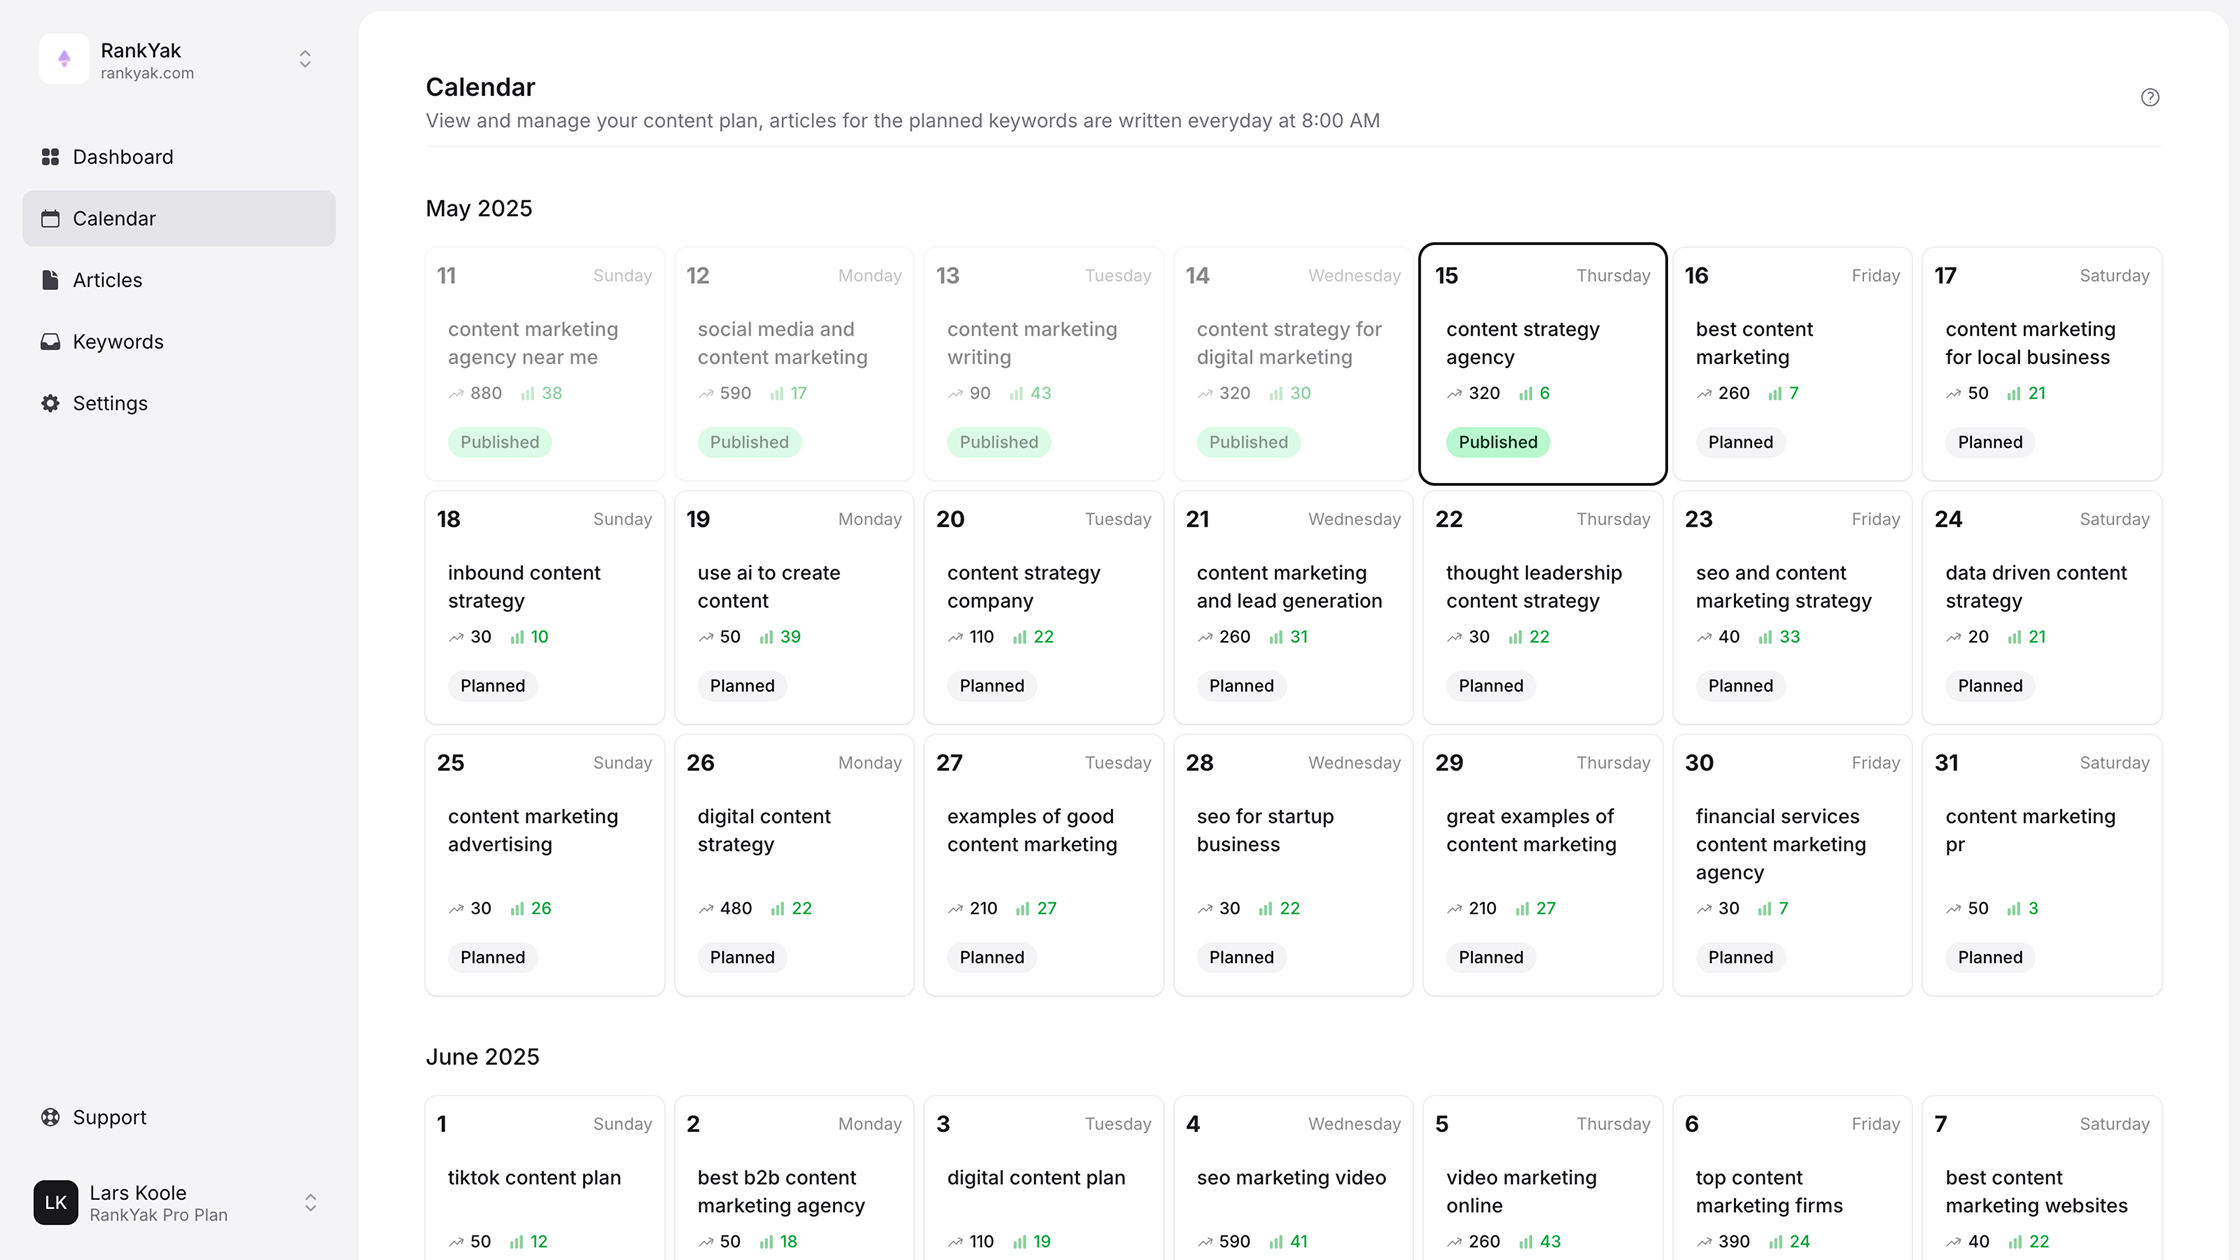
Scaling content output is where most sites stall. Writing, optimizing, and publishing articles manually takes time that compounds quickly. RankYak automates keyword research, article creation, and daily publishing so your GA4 dashboard fills with fresh organic data to analyze every week, without manual work slowing your growth.

Get Google and ChatGPT traffic on autopilot.
Start today and generate your first article within 15 minutes.
SEO revenue calculator
How much revenue is your website leaving on the table?
Take a quick quiz and see exactly how much organic revenue you're missing out on, along with personalized tips to fix it.
-
4 questions, under 1 minute
-
See traffic and revenue potential
-
No email required
Free · takes 1 minute · no signup needed
Question 1 of 4
Question 2 of 4
Question 3 of 4
Question 4 of 4
Your SEO growth potential
Extra visitors / month
after 6-12 months of consistent publishing
Revenue potential / year
at your niche's avg. conversion rate
Articles needed (12 mo)
to reach this traffic level
ROI with RankYak
at $99/mo ($1,188/year)
To hit that number, you'd need to:
- Build a topical authority strategy for your niche
- Research keywords & map out a full topical cluster
- Write, edit & publish an article every single day
- Build backlinks to the articles you publish
RankYak handles all of this automatically, every day.
* Estimates based on industry averages. Results vary by niche, competition, and domain authority. Most SEO results become visible after 3-6 months of consistent publishing.