How To Create SEO Reports That Clients Actually Understand

You've spent weeks optimizing pages, building backlinks, and publishing content. The results are there, rankings are climbing, traffic is up. But when you sit down to explain all of this to a client or stakeholder, their eyes glaze over. Knowing how to create SEO reports that actually communicate progress is a skill most marketers never formally learn. And it shows: reports packed with jargon and raw data end up confusing the very people they're meant to impress.
The problem isn't the data itself. It's how it's organized and presented. A good SEO report doesn't just dump numbers into a spreadsheet. It tells a clear story about what happened, why it matters, and what comes next. When done right, reports build trust, justify budgets, and keep clients engaged month after month. When done poorly, they create doubt, even when the underlying work is solid.
At RankYak, we automate the heavy lifting of SEO, from keyword discovery and content creation to publishing and backlink building. But we also know that showing results matters just as much as getting them. Whether you're using our platform to generate daily optimized content or running SEO manually, you still need a report that makes your work impossible to ignore.
This guide walks you through the entire process step by step. You'll learn which metrics to include (and which to skip), how to structure reports for different audiences, the best tools and templates to speed things up, and presentation techniques that turn data into decisions. Let's build reports your clients will actually read.
What an SEO report is and what it should do
An SEO report is a structured document that shows how a website is performing in organic search over a defined time period. At its core, it covers three things: what changed, why it changed, and what you plan to do next. It is not a raw data export from Google Analytics or a screenshot of a rankings dashboard. It is a curated summary that connects your work to business outcomes, written for an audience that cares more about leads and revenue than crawl errors and canonical tags.
What goes into an SEO report (and what doesn't)
The instinct when learning how to create SEO reports is to include everything: traffic, rankings, backlinks, page speed, crawl stats, impressions, click-through rates, bounce rates, and time on page. The problem is that more data rarely means more clarity. It usually means less. Your report should include only the metrics that connect directly to the goals you agreed on with your client or stakeholder at the start of the project.
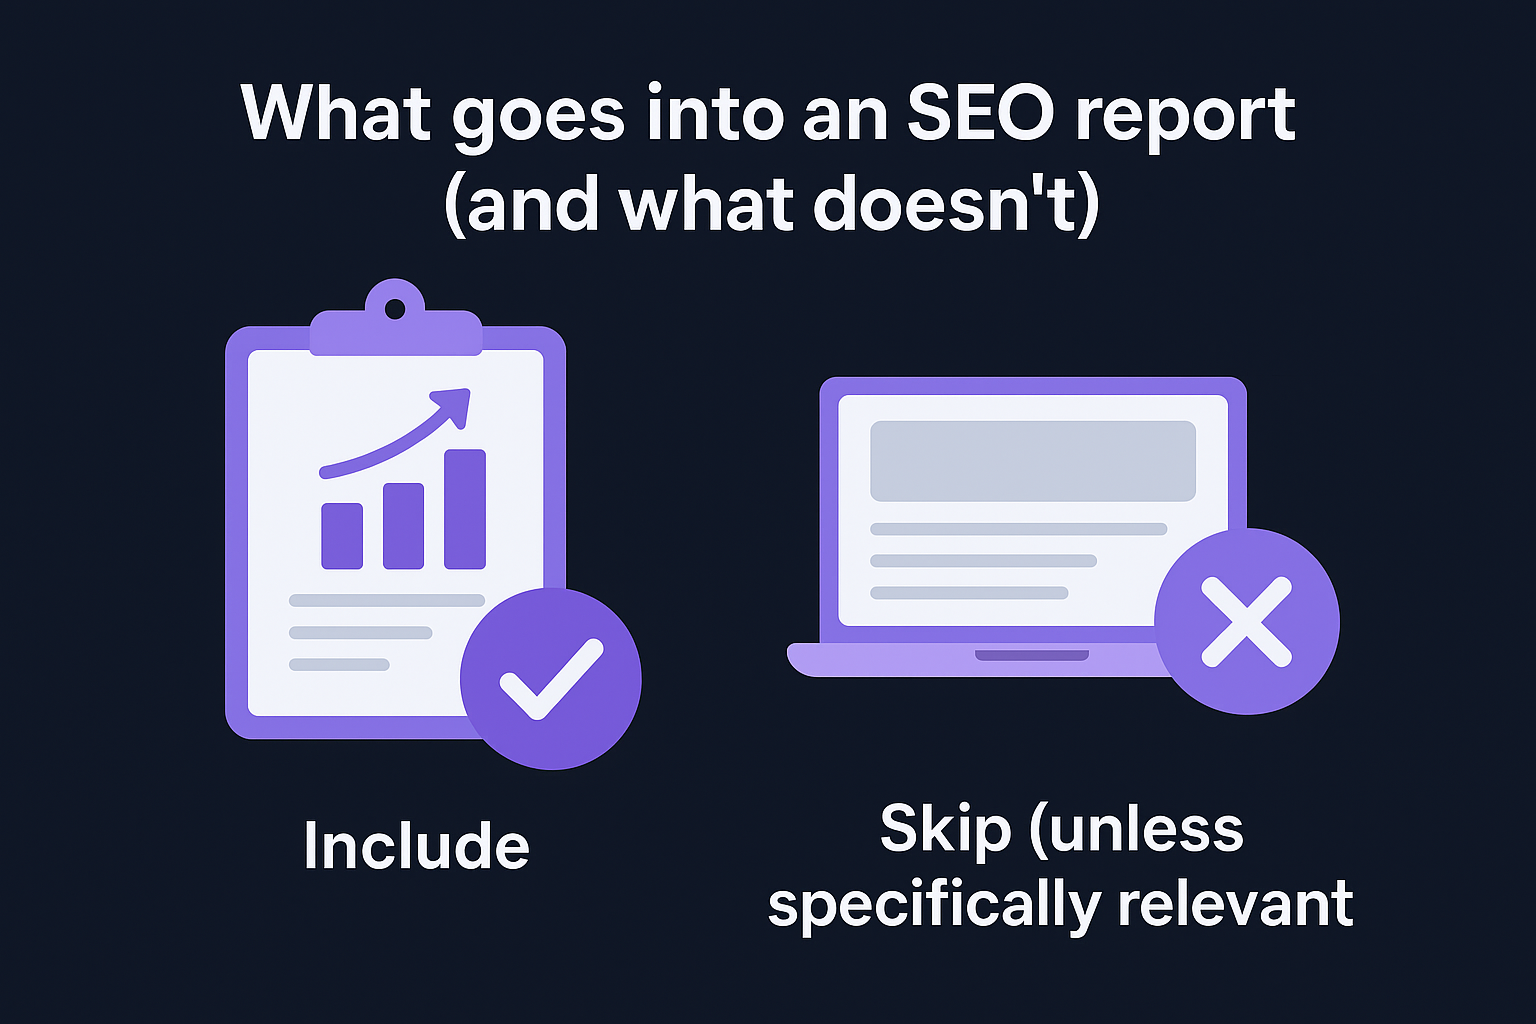
If removing a metric wouldn't change the story you're telling, cut it.
A practical filter: if keeping a metric would confuse someone without an SEO background, cut it unless you can explain it in one sentence. Below is a clear breakdown of what typically earns its place in a report versus what often clutters them:
| Include | Skip (unless specifically relevant) |
|---|---|
| Organic traffic (sessions and users) | Raw crawl data |
| Keyword rankings for target terms | Full list of 404 errors |
| Conversions from organic traffic | Render-blocking resources |
| Backlink growth over time | Exact duplicate content percentages |
| Year-over-year comparisons | Server response time graphs |
| Goal completions tied to organic | Crawl budget statistics |
The second column isn't irrelevant to SEO work. Those items matter when you're conducting technical audits or troubleshooting specific performance issues. But they don't belong in a standard monthly performance report sent to a client who wants to know whether their investment is producing results.
What a good report actually accomplishes
A report does something far more important than proving you did work. It builds or erodes trust depending on how clearly it communicates results. Clients who receive reports they understand are far more likely to renew contracts, refer your services, and give you the budget to do more. Clients who receive reports full of unexplained acronyms and flat data tables start to question what they are actually paying for.
Your report should also function as a decision-making tool. Each section should point toward something: a win to build on, a problem to address, or an opportunity to pursue. When a client finishes reading, they should know the current state of their SEO, understand what drove those results, and feel confident about what happens next.
The difference between a report and a data dump
Raw exports from tools are not reports. They are starting materials. A data dump hands the client numbers without context. A real report takes those same numbers and frames them inside a narrative that connects to goals they already care about. That distinction is what separates reports that generate trust and buy-in from ones that get filed away unread. The format matters less than the clarity of the story you build around the data.
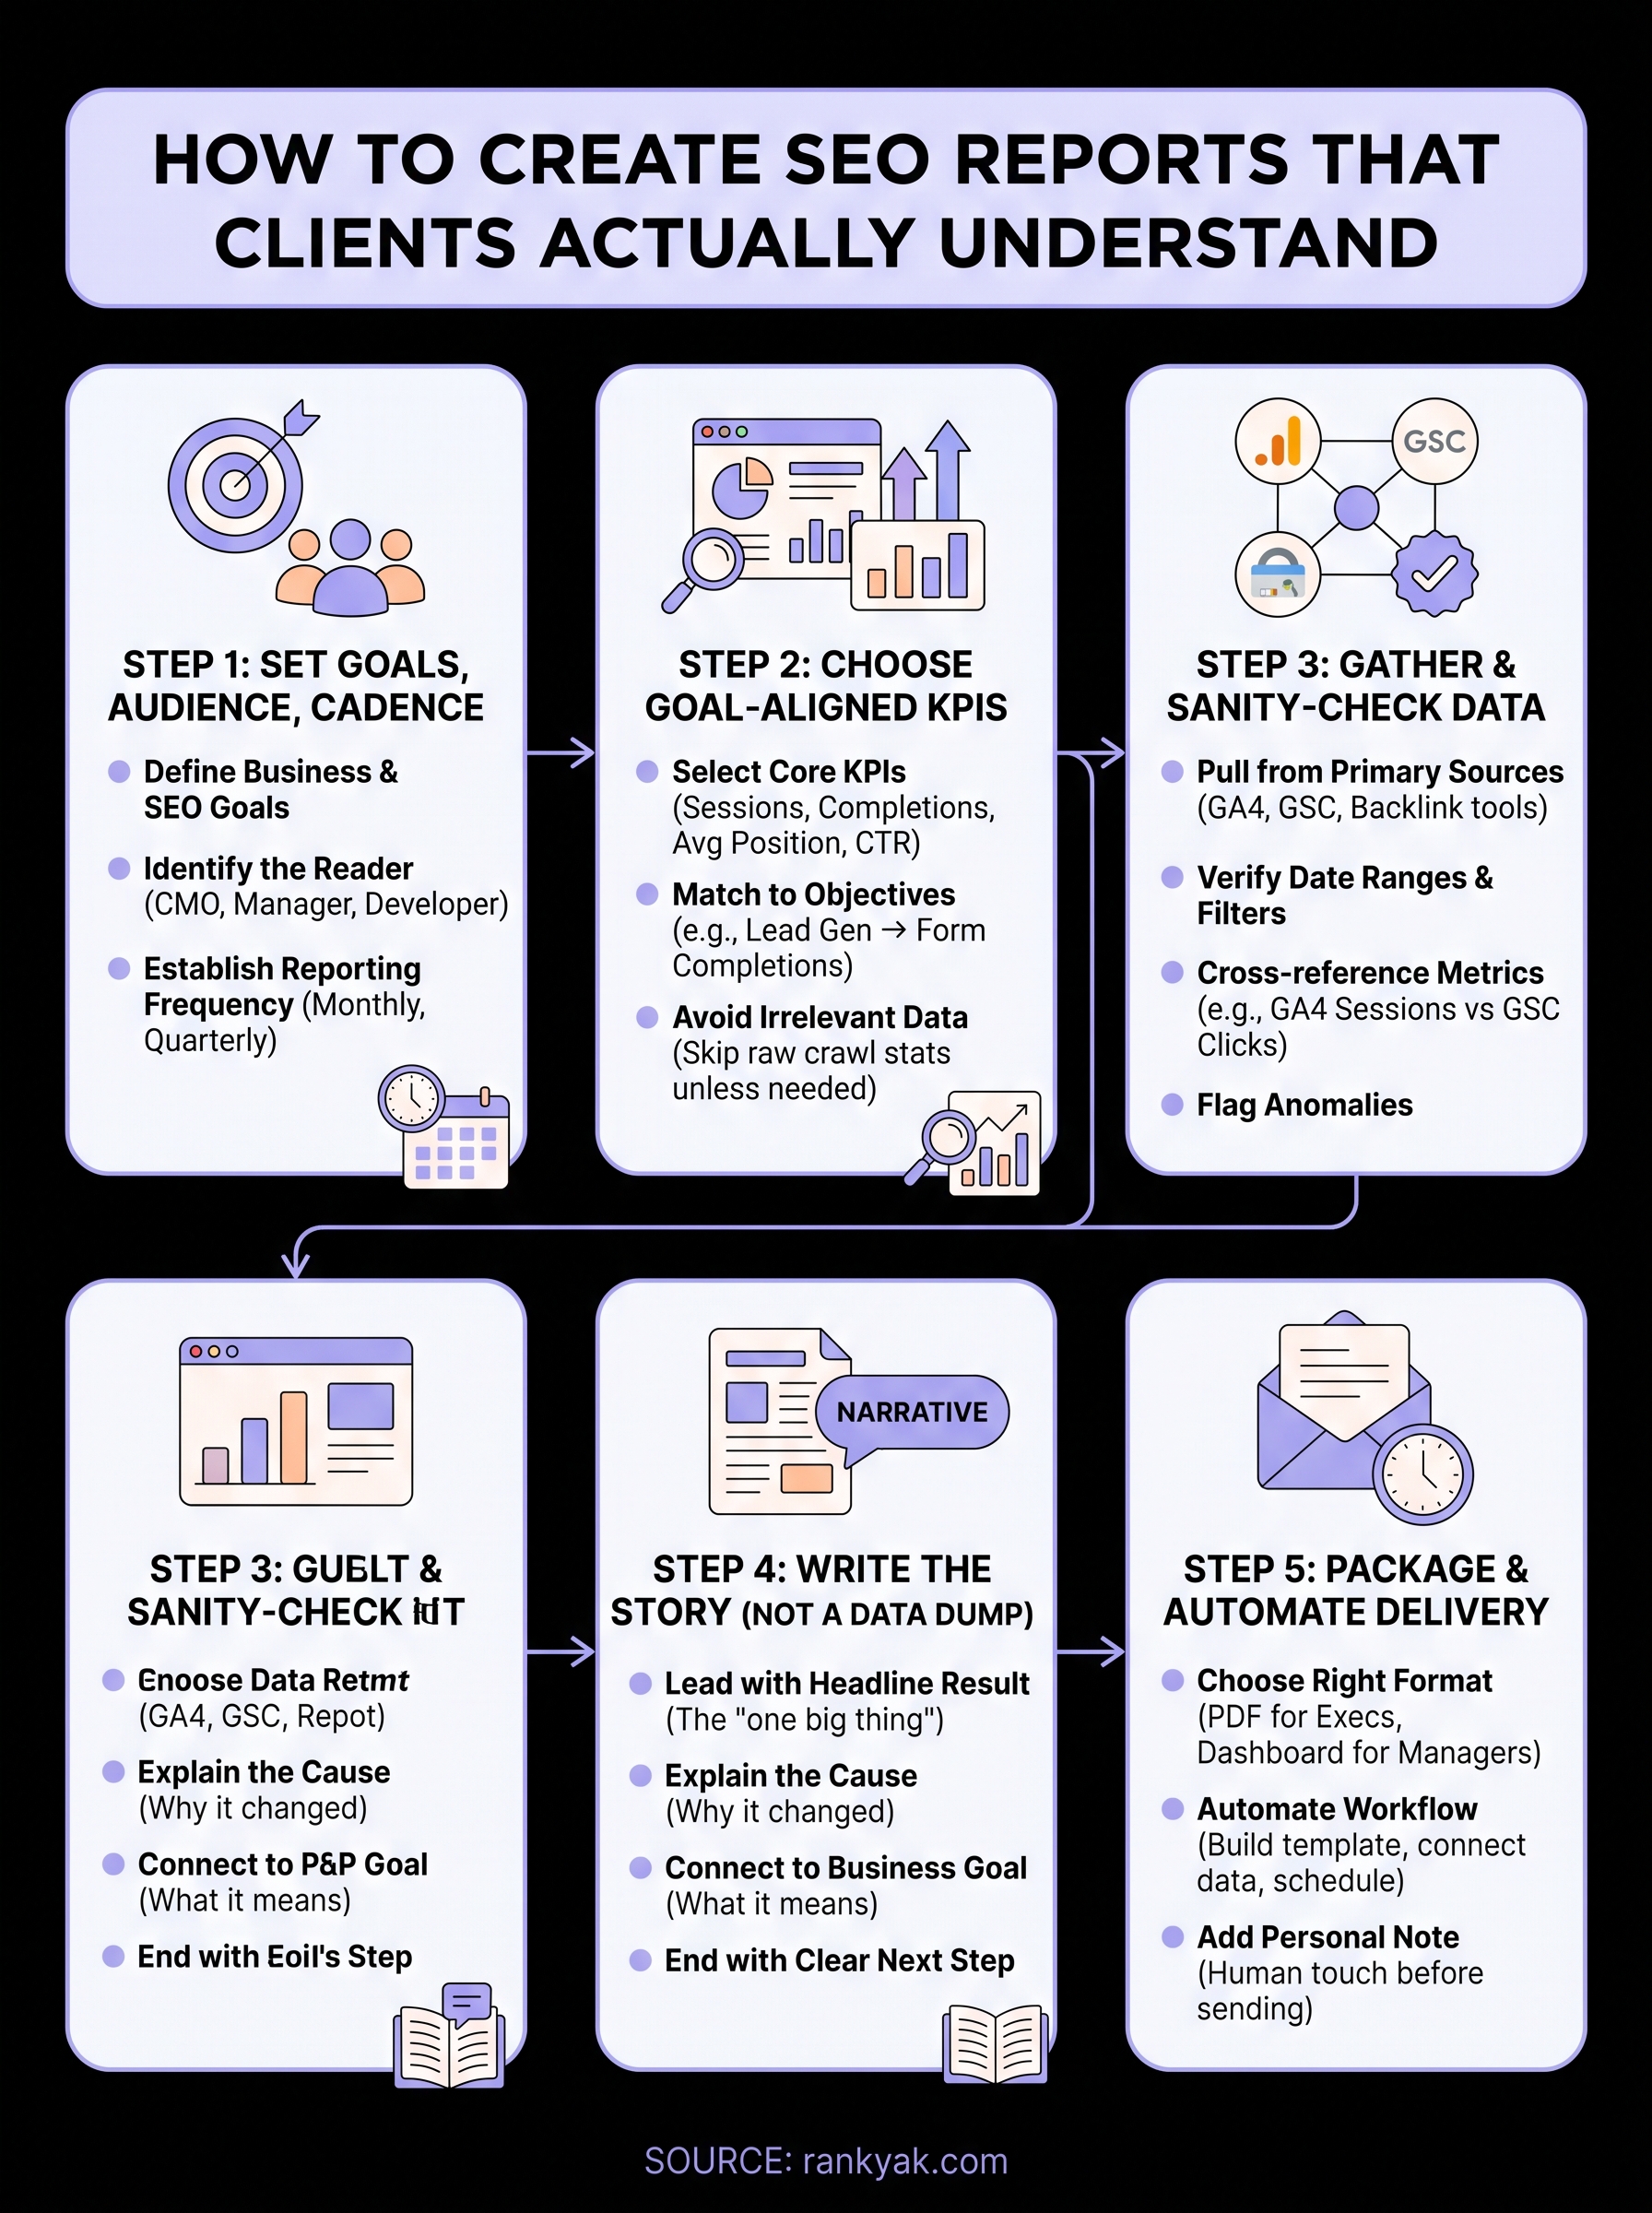
Step 1. Set goals, audience, and cadence
Before you pull a single metric, you need to answer three questions: what is this report trying to show, who is reading it, and how often will they receive it. Skipping this step is the most common reason SEO reports miss the mark. You can produce technically accurate data and still fail to communicate anything useful if the report is not designed around a specific goal and a specific person.
Define the goals first
Every SEO report should tie back to one or more goals that you and your client agreed on before the work began. Those goals determine which metrics matter and which ones you can safely ignore. If the goal is to drive more leads through organic search, then form completions from organic sessions are critical. If the goal is to expand brand visibility in a new market, then impressions and new keyword rankings take priority.
Set your goals in writing before you start any reporting cycle, so both sides agree on what success looks like.
A simple goals table at the start of your report template keeps everyone aligned:
| Business Goal | SEO Goal | Primary Metric |
|---|---|---|
| Generate more leads | Rank for high-intent keywords | Organic goal completions |
| Increase brand awareness | Grow impressions in target market | Clicks and impressions (GSC) |
| Reduce paid ad spend | Capture traffic going to ads | Organic sessions on commercial pages |
| Grow e-commerce revenue | Rank product and category pages | Organic-assisted transactions |
Know your audience before you write
The format and language of your report should change based on who reads it. A CMO wants a two-page executive summary with clear business outcomes. A marketing manager wants a bit more detail on what drove the changes. An in-house developer reviewing technical SEO results needs specifics. Knowing who you are writing for before you start is what separates a useful report from one that gets ignored.
When you learn how to create SEO reports for multiple stakeholders, the most practical approach is to build one core document and adjust the summary section for each audience. Keep the raw data in an appendix so technical readers can dig deeper without cluttering the main view.
Set a reporting cadence and stick to it
Consistency builds trust faster than any single impressive result you could report. Monthly reports work well for most ongoing SEO retainers. Quarterly reports suit executive stakeholders who want a higher-level view. Weekly reports are rarely necessary unless you are managing a campaign with rapid changes, such as a site migration or a product launch, and they can create the impression that small fluctuations carry more weight than they actually do.
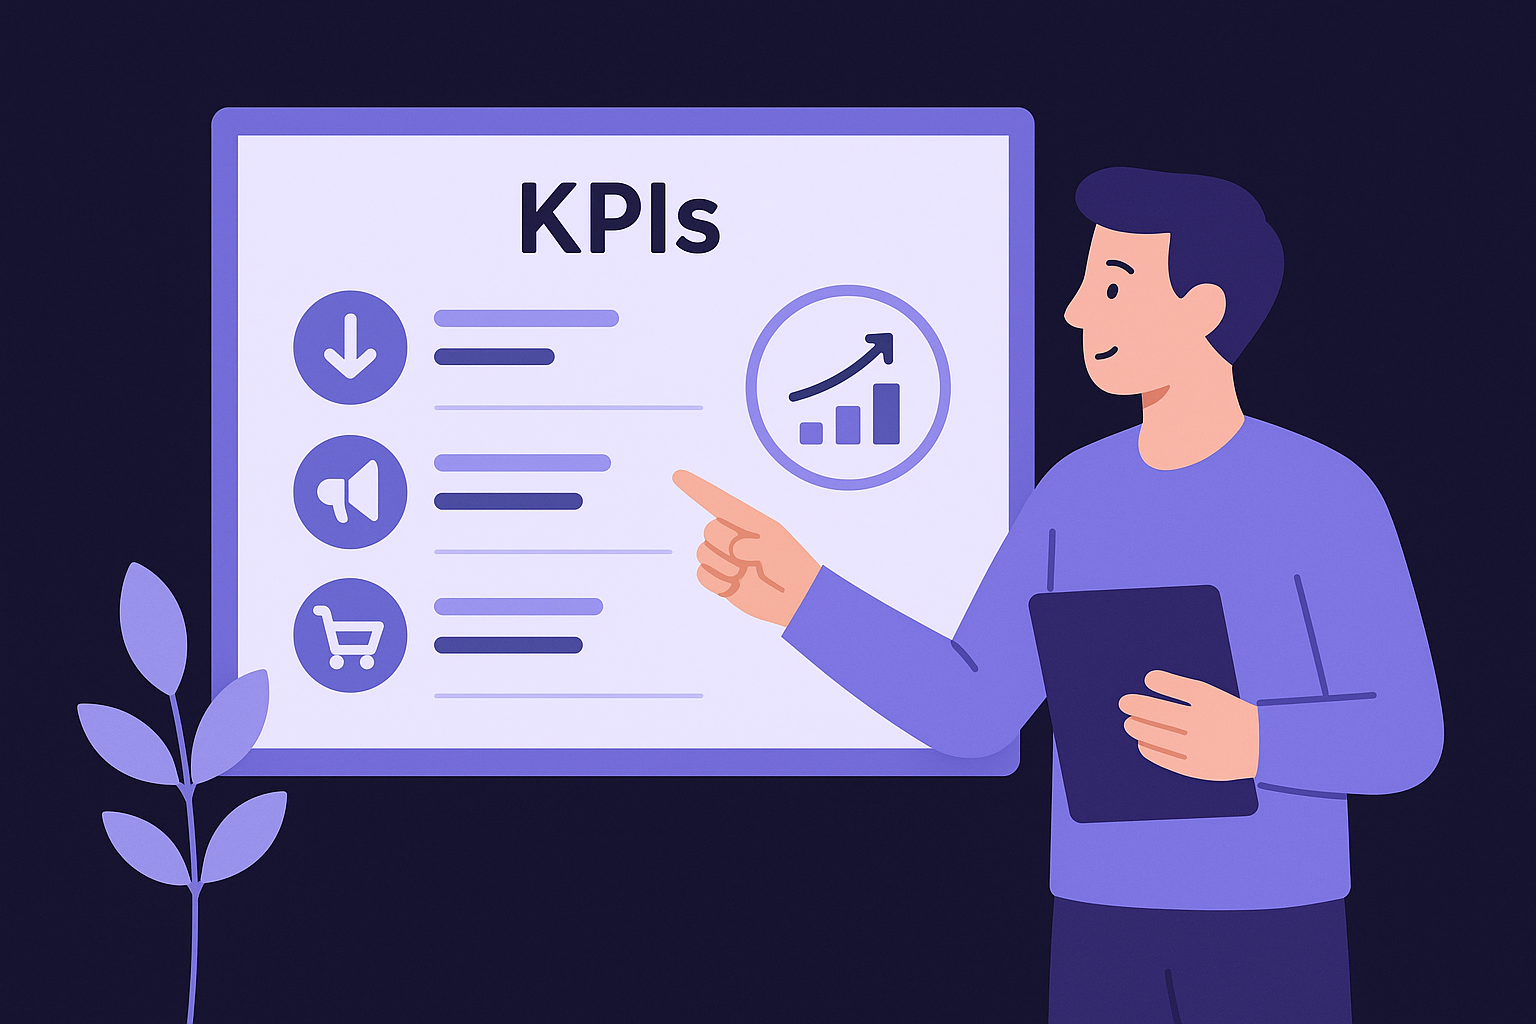
Step 2. Choose KPIs that match those goals
Once your goals are set, you need to select the specific KPIs that actually measure progress toward them. This is where many people get stuck when learning how to create SEO reports: they either include too many metrics and lose the reader, or they pick generic ones that don't connect to what the client actually cares about. A strong KPI selection is tight, goal-driven, and defensible. You should be able to explain in one sentence why each metric is in the report.
Pick KPIs that answer one question: does this number tell us whether we're moving toward the goal?
The core KPIs most reports need
Most SEO reports share a common set of metrics that almost always earn their place. Organic sessions show how much search traffic your work is pulling in. Goal completions from organic connect that traffic to real business value. Keyword ranking movement on your target terms shows whether your content strategy is working. Click-through rate (CTR) from Google Search Console tells you whether your titles and meta descriptions are compelling enough to earn clicks even when you rank well.
Here's a quick reference for core KPIs and where to pull them:
| KPI | Source | What it tells you |
|---|---|---|
| Organic sessions | Google Analytics | Volume of search-driven visits |
| Organic goal completions | Google Analytics | Revenue or lead impact |
| Average keyword position | Google Search Console | Ranking health for target terms |
| Impressions | Google Search Console | Visibility in search results |
| CTR | Google Search Console | Title and meta description effectiveness |
| New referring domains | Your backlink tool | Link-building progress |
KPIs to match specific business objectives
Different goals require different primary KPIs, and mixing them up is a fast way to confuse your client. If your client's goal is lead generation, organic goal completions and conversion rate from organic sessions are what you lead with. Impressions matter far less to them than the number of people who filled out a form. If the goal is market expansion, impressions and new keyword coverage in the target geography tell a clearer story than conversion data.
Use this mapping to pick the right metrics for each client situation:
| Goal | Primary KPI | Secondary KPI |
|---|---|---|
| Lead generation | Organic goal completions | Conversion rate from organic |
| Brand awareness | Impressions | New keywords ranking |
| E-commerce growth | Organic-assisted transactions | Revenue from organic sessions |
| Content visibility | Organic sessions to new pages | Average position for target terms |
Resist the urge to pad the report with metrics that look impressive but don't connect to the goal you set in Step 1. Every extra number you add forces the reader to decide whether it matters, and that friction erodes the clarity of your entire report.
Step 3. Gather data and sanity-check it
Once you know which KPIs to track, you need to pull the right data from the right sources and verify it before a single number goes into your report. Skipping the sanity-check step is how you end up presenting inflated traffic numbers from a bot spike or missing a GA4 filter that was quietly stripping out organic sessions for two weeks. Bad data destroys credibility faster than any communication mistake, so build a consistent collection and verification habit before you start formatting.
Where to pull your data from
Most SEO reports draw from a small set of primary sources. Knowing which tool owns which metric saves you time and prevents duplicate counting when you learn how to create SEO reports across multiple clients. Use Google Search Console for impressions, clicks, CTR, and average position. Use Google Analytics 4 for sessions, conversions, and revenue tied to organic traffic. Use your backlink tool for domain growth and referring domain changes.
Here is a quick source map you can use every reporting cycle:
| Metric | Primary Source | Where to find it |
|---|---|---|
| Organic sessions | Google Analytics 4 | Reports > Acquisition > Traffic Acquisition |
| Goal completions | Google Analytics 4 | Reports > Engagement > Conversions |
| Impressions and clicks | Google Search Console | Performance > Search Results |
| Average position | Google Search Console | Performance > Search Results |
| New referring domains | Backlink tool | Domain overview or link profile section |
How to sanity-check before you report
Before you lock in any numbers, run through a quick verification pass on each metric. Start by comparing the date range you selected against the previous period to make sure the windows are the same length. Then check whether any filters or segments are applied in GA4 that could be excluding part of your organic traffic without you realizing it.
If a metric looks dramatically different from the previous period, investigate the cause before you report it, not after a client asks.
Run through this checklist for every report you prepare:
- Confirm date ranges match on all platforms
- Check that GA4 is not applying an active comparison filter from a previous session
- Verify Google Search Console data covers the full period and is not cut off by a 28-day delay
- Cross-reference organic sessions in GA4 against clicks in GSC to spot large gaps
- Flag any data anomalies in the report itself with a short explanation so clients see you caught them first
Step 4. Write the story behind the numbers
Data alone does not persuade anyone. The numbers in your report only become useful when you frame them inside a narrative that connects to goals your client already cares about. This is the step that separates professionals who know how to create SEO reports from those who just export dashboards. Your job here is to write short, direct commentary that explains what happened, why it happened, and what you will do about it next.
Lead with the headline result
Every report should open with a one- to three-sentence summary that tells the reader the single most important thing that happened during the reporting period. This is not a teaser or a cliffhanger. It is a direct statement of the outcome, written in plain language that a non-SEO reader can grasp in under 30 seconds.
Your headline result should connect directly to the business goal you set in Step 1, not to an SEO metric your client has never heard of.
For example: "Organic sessions grew 18% month over month, and goal completions from organic search increased by 11, driven by three new blog posts that ranked in the top five for high-intent keywords." That one sentence tells the client what changed, how much, and why. Start every report you write with exactly this structure.
Build the narrative section by section
After your headline result, move through each KPI block with a two-part pattern: state the number, then explain the cause. Clients do not want you to describe what they can already see in the chart. They want you to tell them what caused the movement and whether it is something to build on or address.

Use this commentary template for each metric block:
Metric: [Metric name]
Result: [Number] vs [Previous period number] ([% change])
Why it changed: [1-2 sentence explanation of the root cause]
What this means: [1 sentence connecting to the business goal]
For example:
Metric: Organic goal completions
Result: 34 vs 23 last month (+48%)
Why it changed: Four product pages moved from position 8-12 to positions 3-6 after on-page updates in week two.
What this means: Organic is now generating roughly one additional lead per day compared to last month.
End with a clear next step
Close the narrative section with a short forward-looking paragraph that tells the client exactly what you plan to do in the next reporting period. One to three specific actions is enough. This keeps your client oriented toward progress rather than fixating on any numbers that missed expectations, and it gives them a reason to look forward to the next report.
Step 5. Package and automate delivery
Once your narrative is written, you need to package the report in a format your client will open and set up a delivery system that removes manual work from your process. Knowing how to create SEO reports efficiently means not rebuilding the same document from scratch every month. The goal is a repeatable, automated workflow that gets the right format to the right person on schedule, without you spending hours on formatting each cycle.
The best report in the world does nothing if it sits in a draft folder because you ran out of time to send it.
Choose the right format for your audience
Different audiences need different formats, and choosing the wrong one creates friction before your client even reads the first number. PDFs work well for executive stakeholders who want a polished, static document they can save and share in a board meeting. Live dashboard links work better for marketing managers who want to check numbers between reporting cycles without waiting for you to send an update.
Use this format guide to match delivery method to audience type:
| Audience | Best Format | Why |
|---|---|---|
| Executive / C-suite | PDF report with summary page | Static, shareable, easy to read offline |
| Marketing manager | Live dashboard + PDF summary | Self-serve access between reports |
| In-house developer | Raw data export + notes | Technical detail without narrative overhead |
| Agency client (retainer) | PDF with commentary sections | Professional, audit-ready, brand-consistent |
Automate the delivery so it actually happens
Manual report delivery breaks down the moment you get busy. Build a system that sends reports on schedule without requiring you to remember. For PDF reports, use Google Looker Studio to build your template once and set up scheduled email delivery so the report goes out automatically on the first of every month.
Follow this setup sequence to get it running:
1. Build report template in Google Looker Studio
2. Connect data sources: GA4, Google Search Console, backlink tool via connector
3. Set date range to "last 30 days" (auto-updates each cycle)
4. Go to Share > Schedule delivery
5. Add client email, set frequency to monthly, pick send date
6. Send a short personal email note outside the automated system to flag key highlights
Step 6 in that sequence matters more than most people realize. Automated delivery handles the mechanics, but a short personal note from you keeps the client relationship human and gives you a chance to direct their attention to the most important result before they open the report.
Simple next steps
You now have a complete framework for how to create SEO reports that clients actually read and trust. Start with the goals table from Step 1 to align on what success looks like before you pull any data. Then build your KPI list, collect and verify your data, write a short narrative for each metric block, and set up automated delivery in Looker Studio so the process runs on schedule every month.
Pick one client report you have coming up and apply this structure to it. Drop everything you cannot connect to a business goal. Write a headline result in the first paragraph. Add a forward-looking action item at the end. Send it on time.
If you want to make the underlying SEO work easier to report on because the results are actually there, try RankYak's automated content and SEO platform and start producing daily optimized content that gives you real numbers worth reporting.

Get Google and ChatGPT traffic on autopilot.
Start today and generate your first article within 15 minutes.
SEO revenue calculator
How much revenue is your website leaving on the table?
Take a quick quiz and see exactly how much organic revenue you're missing out on, along with personalized tips to fix it.
-
4 questions, under 1 minute
-
See traffic and revenue potential
-
No email required
Free · takes 1 minute · no signup needed
Question 1 of 4
Question 2 of 4
Question 3 of 4
Question 4 of 4
Your SEO growth potential
Extra visitors / month
after 6-12 months of consistent publishing
Revenue potential / year
at your niche's avg. conversion rate
Articles needed (12 mo)
to reach this traffic level
ROI with RankYak
on the Professional plan ($129/mo)
To hit that number, you'd need to:
- Build a topical authority strategy for your niche
- Research keywords & map out a full topical cluster
- Write, edit & publish an article every single day
- Build backlinks to the articles you publish
RankYak handles all of this automatically, every day.
* Estimates based on industry averages. Results vary by niche, competition, and domain authority. Most SEO results become visible after 3-6 months of consistent publishing.