How To Track SEO Performance With Metrics, Tools & Reports

You're publishing content, building backlinks, and optimizing pages, but how do you know any of it is actually working? If you can't track SEO performance with clear data, you're essentially flying blind. And flying blind means wasting time and budget on strategies that may never move the needle.
The truth is, SEO generates results over weeks and months, not hours. That makes consistent measurement the only reliable way to separate what's driving growth from what's just noise. Without it, you'll either double down on the wrong tactics or abandon the right ones too early.
This guide breaks down exactly how to monitor your SEO efforts from start to finish. You'll learn which metrics actually matter (and which ones just look impressive), the tools worth using to collect that data, and how to build reports that make progress obvious. Whether you're tracking results from content you write yourself or articles RankYak publishes automatically to your site each day, the framework here applies. By the end, you'll have a repeatable system for proving, and improving, your organic search results.
What SEO performance tracking includes in 2026
SEO tracking used to mean checking keyword rankings and watching organic traffic numbers in Google Analytics. In 2026, the scope is wider. To track SEO performance accurately, you need to account for how your content performs in Google Search, AI-powered chat platforms like ChatGPT and Perplexity, and across multiple touchpoints in the broader search experience. The fundamentals still apply, but the channels and signals that matter have multiplied, which means your tracking system needs to reflect that.
Google Search and AI visibility are now inseparable
Search behavior shifted significantly over the past two years. A growing share of queries now get answered directly in AI Overviews inside Google Search, and a separate portion of users turn to AI chat tools like ChatGPT, Gemini, and Perplexity for research and product recommendations. If your site appears in traditional blue-link results but gets skipped in AI-generated summaries, you're missing a real slice of potential traffic. Tracking both forms of visibility gives you a complete picture of how your brand shows up when people search for topics in your niche.
Ranking on page one is no longer enough if your content isn't structured to appear in AI Overviews and generative chat responses.
Your content needs to satisfy Google's helpful content standards while also being citable by AI systems that pull from authoritative, well-structured sources. Optimizing for both overlaps more than you'd expect: clear structure, accurate information, and genuine depth satisfy both Google's ranking systems and AI crawlers. That means a single content investment can pay off across multiple discovery channels simultaneously.
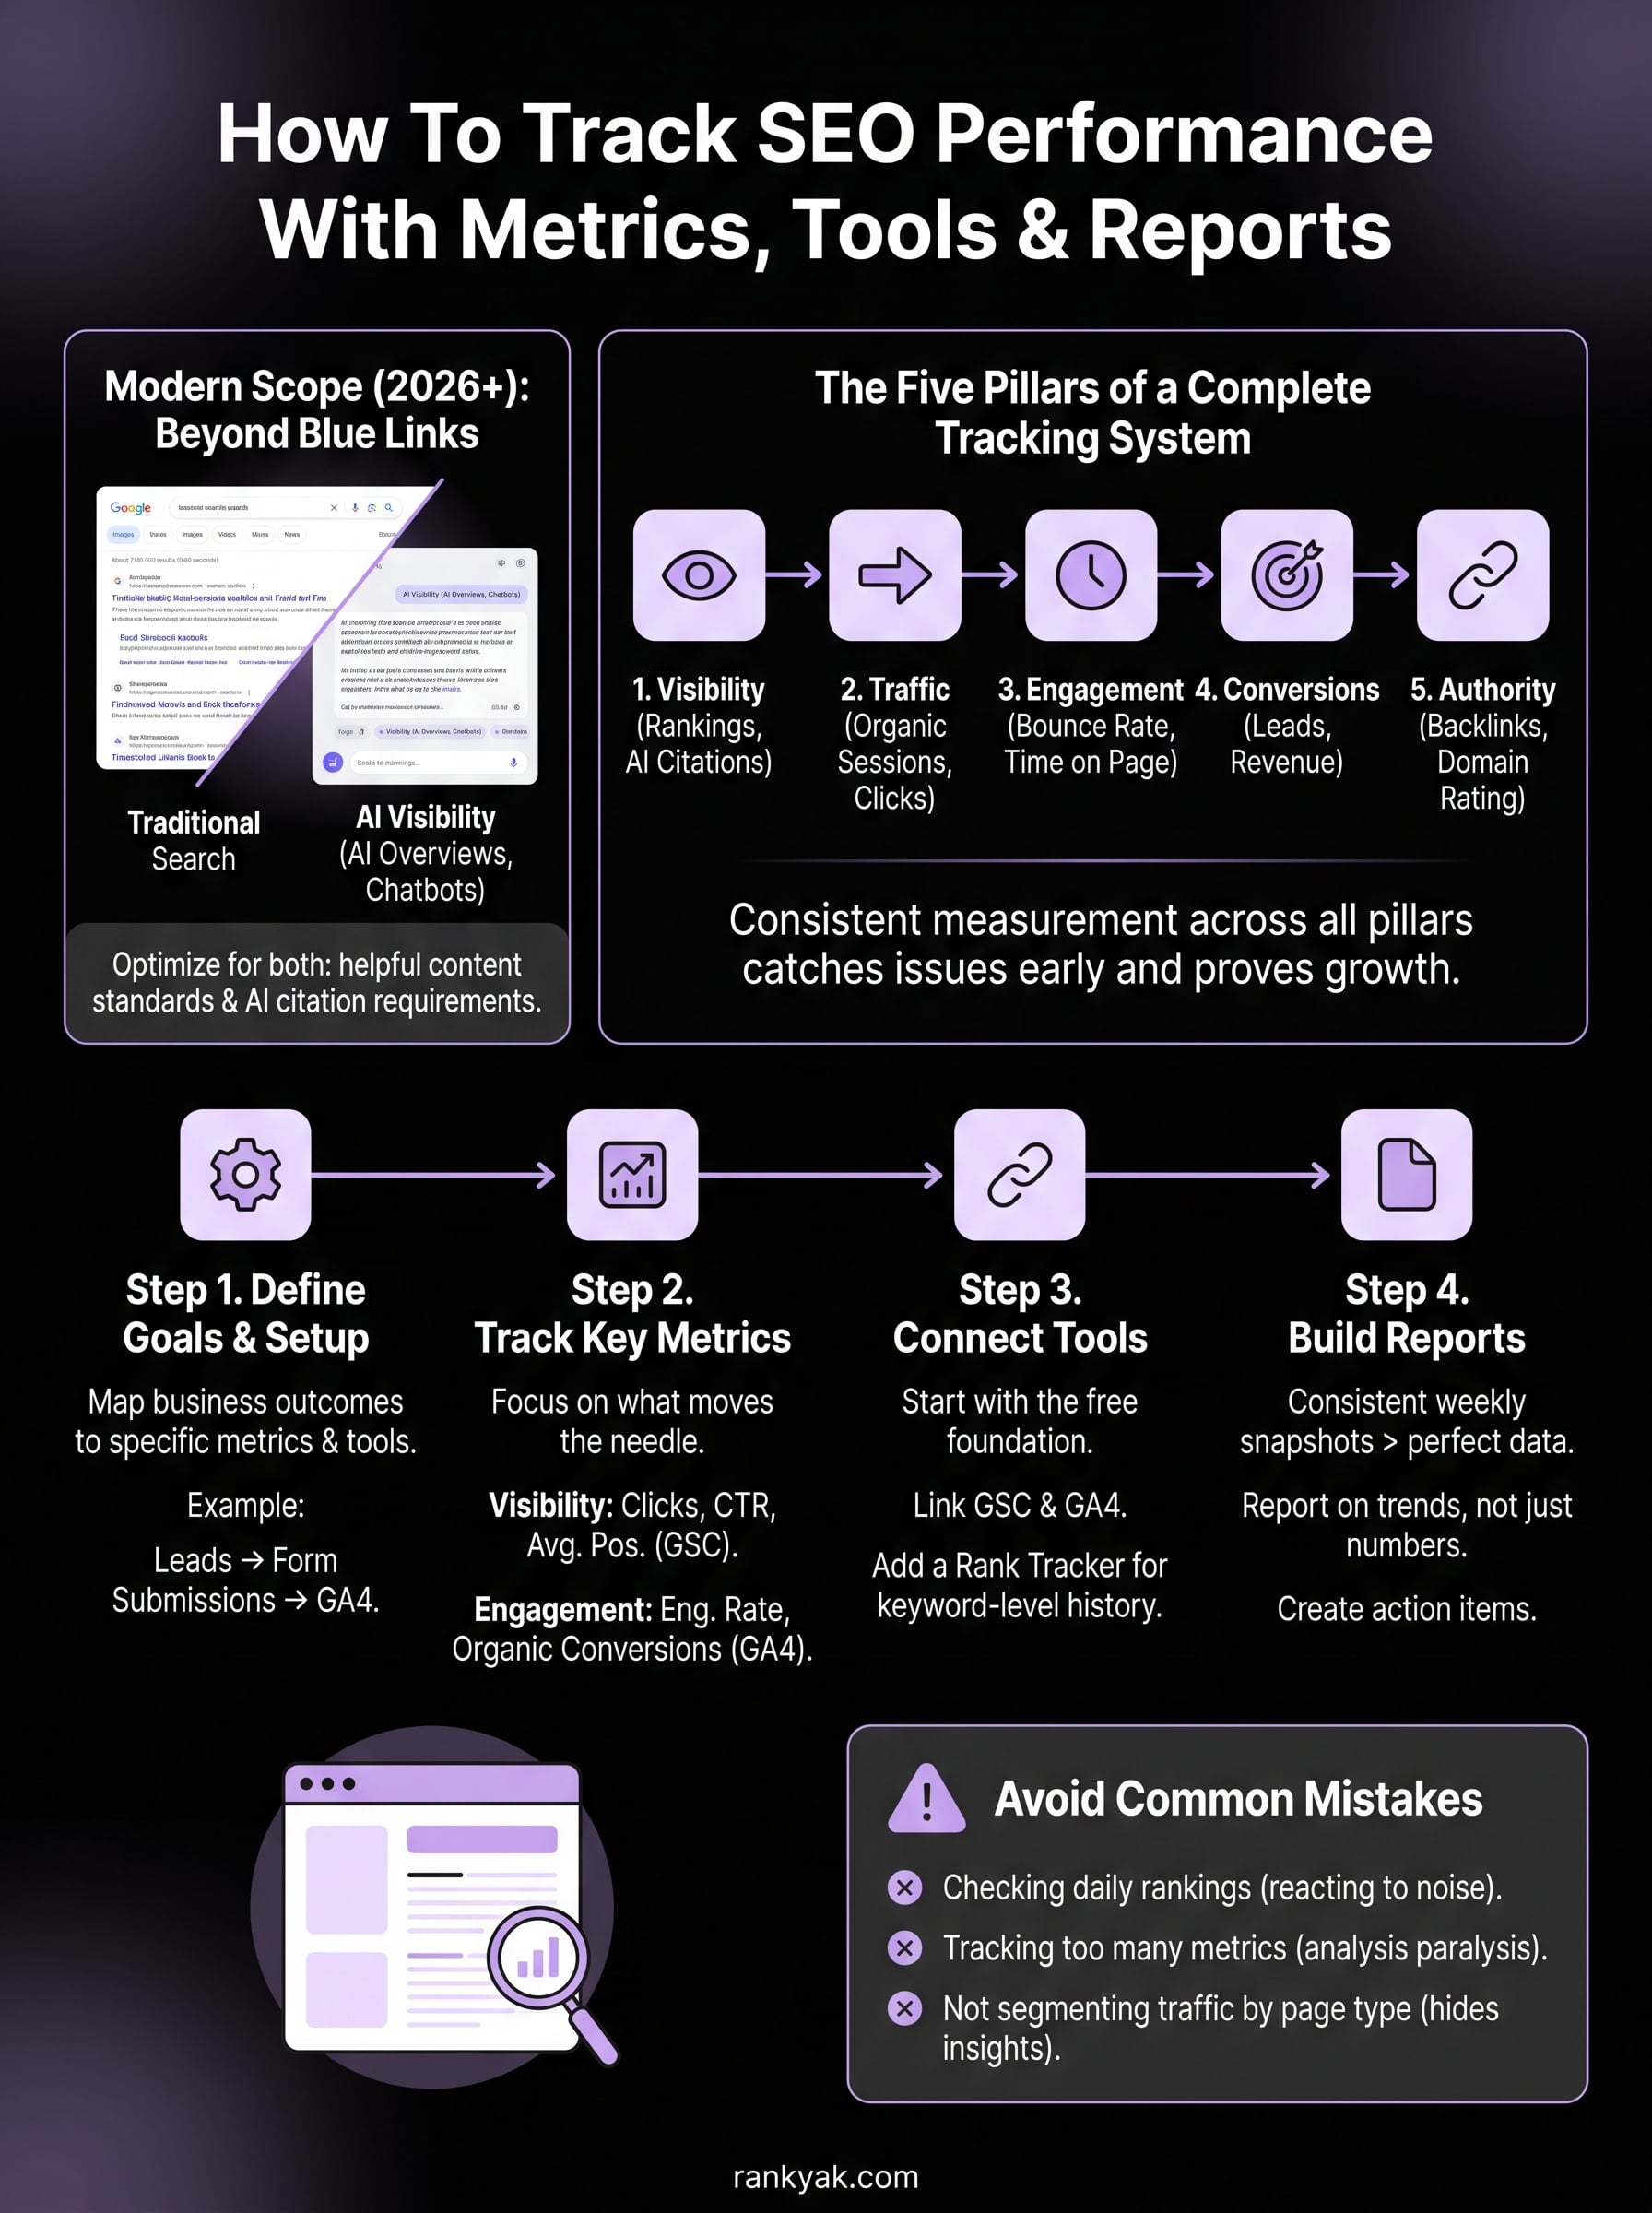
The five pillars of a complete tracking system
Modern SEO tracking breaks down into five distinct areas, each measuring a different aspect of your site's search health. Focusing on all five gives you early warning signals when something goes wrong and clear evidence when a strategy is working.
![]()
| Pillar | What it tracks |
|---|---|
| Visibility | Rankings, impressions, and AI citation frequency |
| Traffic | Organic sessions, clicks, and landing page performance |
| Engagement | Bounce rate, time on page, and scroll depth |
| Conversions | Goals, leads, and revenue attributed to organic search |
| Authority | Backlink count, domain rating, and referring domain growth |
Each pillar connects to the others. A drop in authority often precedes a drop in visibility; a drop in engagement signals a content quality problem before your rankings slip. Building your tracking system around all five means you catch issues early rather than after they've already cost you significant traffic and revenue.
Why consistency matters more than perfection
Many site owners delay building a tracking system because they want to set it up perfectly before they start. That's the wrong approach. Starting with imperfect data collected consistently over time is far more valuable than waiting for the perfect setup. Trends are what drive decisions, and trends require a baseline, which you can only build by starting.
Pulling a report once a month tells you what happened. Reviewing consistent weekly snapshots tells you why it happened and when the shift began. The goal of everything in this guide is to give you a repeatable, practical process you can run without spending hours on it every week.
Step 1. Define goals and set up measurement
Before you can track SEO performance meaningfully, you need to know what success looks like for your specific site. Vague goals like "get more traffic" make it impossible to know whether your SEO work is actually paying off. You need specific, measurable targets tied to real business outcomes, whether that's lead form submissions, product purchases, newsletter signups, or phone calls.
Connect your goals to measurable outcomes
Every SEO goal you set should map directly to a business outcome. If you run an e-commerce store, your primary goal might be organic revenue. If you run a service business, it might be qualified contact form submissions from organic visitors. The specific metric you track should reflect what actually matters to your bottom line, not just what's easiest to measure.
Tracking organic sessions alone is vanity data unless you also track what those visitors do after they land on your site.
Use this framework to map your goals before you configure any tool:
| Business goal | SEO metric to track | Measurement tool |
|---|---|---|
| Generate leads | Organic contact form completions | Google Analytics 4 |
| Grow revenue | Organic-attributed transactions | Google Analytics 4 |
| Build awareness | Impressions and click-through rate | Google Search Console |
| Rank for target keywords | Average position by keyword | Google Search Console |
| Build authority | Referring domain growth | Third-party rank tracker |
Install your baseline tracking tools
Once your goals are mapped, install two tools immediately if you haven't already: Google Search Console and Google Analytics 4. Search Console shows you how Google sees your site, including impressions, clicks, and keyword rankings. Analytics 4 shows you what visitors do once they arrive, which lets you connect organic traffic to real conversions.
![]()
Getting these configured correctly from the start saves you from months of missing data you can never recover. In Google Analytics 4, create at least one conversion event that matches your primary business goal. In Search Console, verify your property, submit your XML sitemap, and confirm your domain covers both www and non-www versions. These steps take under an hour and form the foundation for every report you'll build going forward.
Step 2. Track the metrics that actually move results
Not every number in your analytics dashboard deserves your attention. To track SEO performance effectively, you need to focus on metrics that directly signal whether your content is gaining visibility, attracting the right visitors, and converting them into real business outcomes. Everything else is background noise that distracts you from what's actually working.
Visibility and traffic metrics
Your first priority is understanding how often your content appears in search results and how often people click through. Google Search Console gives you four core visibility metrics: impressions, clicks, click-through rate (CTR), and average position. Impressions tell you how many times your pages appeared in results; clicks tell you how many people actually visited. CTR is the ratio between the two, and a low CTR on a high-impression page signals a title or meta description that isn't compelling enough to earn the click.
A page ranking in position 4 with a 2% CTR is a bigger opportunity than a page at position 12. Fix the headline and meta description first before chasing a higher rank.
| Metric | What it signals | Where to find it |
|---|---|---|
| Impressions | Search visibility for your target keywords | Google Search Console |
| Clicks | Actual traffic from organic results | Google Search Console |
| CTR | How well your listing converts searchers | Google Search Console |
| Average position | Ranking level across all queries | Google Search Console |
Engagement and conversion metrics
Once visitors land on your pages, engagement metrics tell you whether your content is doing its job. In Google Analytics 4, focus on engagement rate (the inverse of bounce rate), average engagement time per session, and scroll depth on key pages. A page with strong rankings but low engagement time usually has a content relevance problem: it ranked for a query it doesn't fully answer.
Beyond engagement, tie your organic traffic to actual conversions. In GA4, filter your conversion events by the "Organic Search" traffic source to get a direct line between your SEO work and business outcomes like leads, purchases, or signups. Review these numbers weekly alongside your Search Console data, and you'll quickly see which content topics produce both traffic and conversions, not just one or the other.
Step 3. Choose the right tools and connect your data
The right toolset lets you track SEO performance without spending hours chasing data across disconnected dashboards. Most sites need fewer tools than they think. A focused stack of two or three platforms covers the majority of what you need to monitor rankings, traffic, and conversions accurately.
Start with the free foundation
Google Search Console and Google Analytics 4 are non-negotiable starting points, and both are free. Search Console feeds you raw search data directly from Google: impressions, clicks, average position, and index coverage. Google Analytics 4 captures on-site behavior and conversion data once visitors land. Together, these two tools answer most of the questions you'll have about organic performance week to week.
If you only set up one tool, make it Google Search Console. It gives you data no third-party tool can fully replicate.
To connect them, open your Search Console property, click Settings, then click "Associations," and link your GA4 property. Once linked, you can view Search Console data directly inside GA4 reports, which removes the need to switch between platforms constantly.
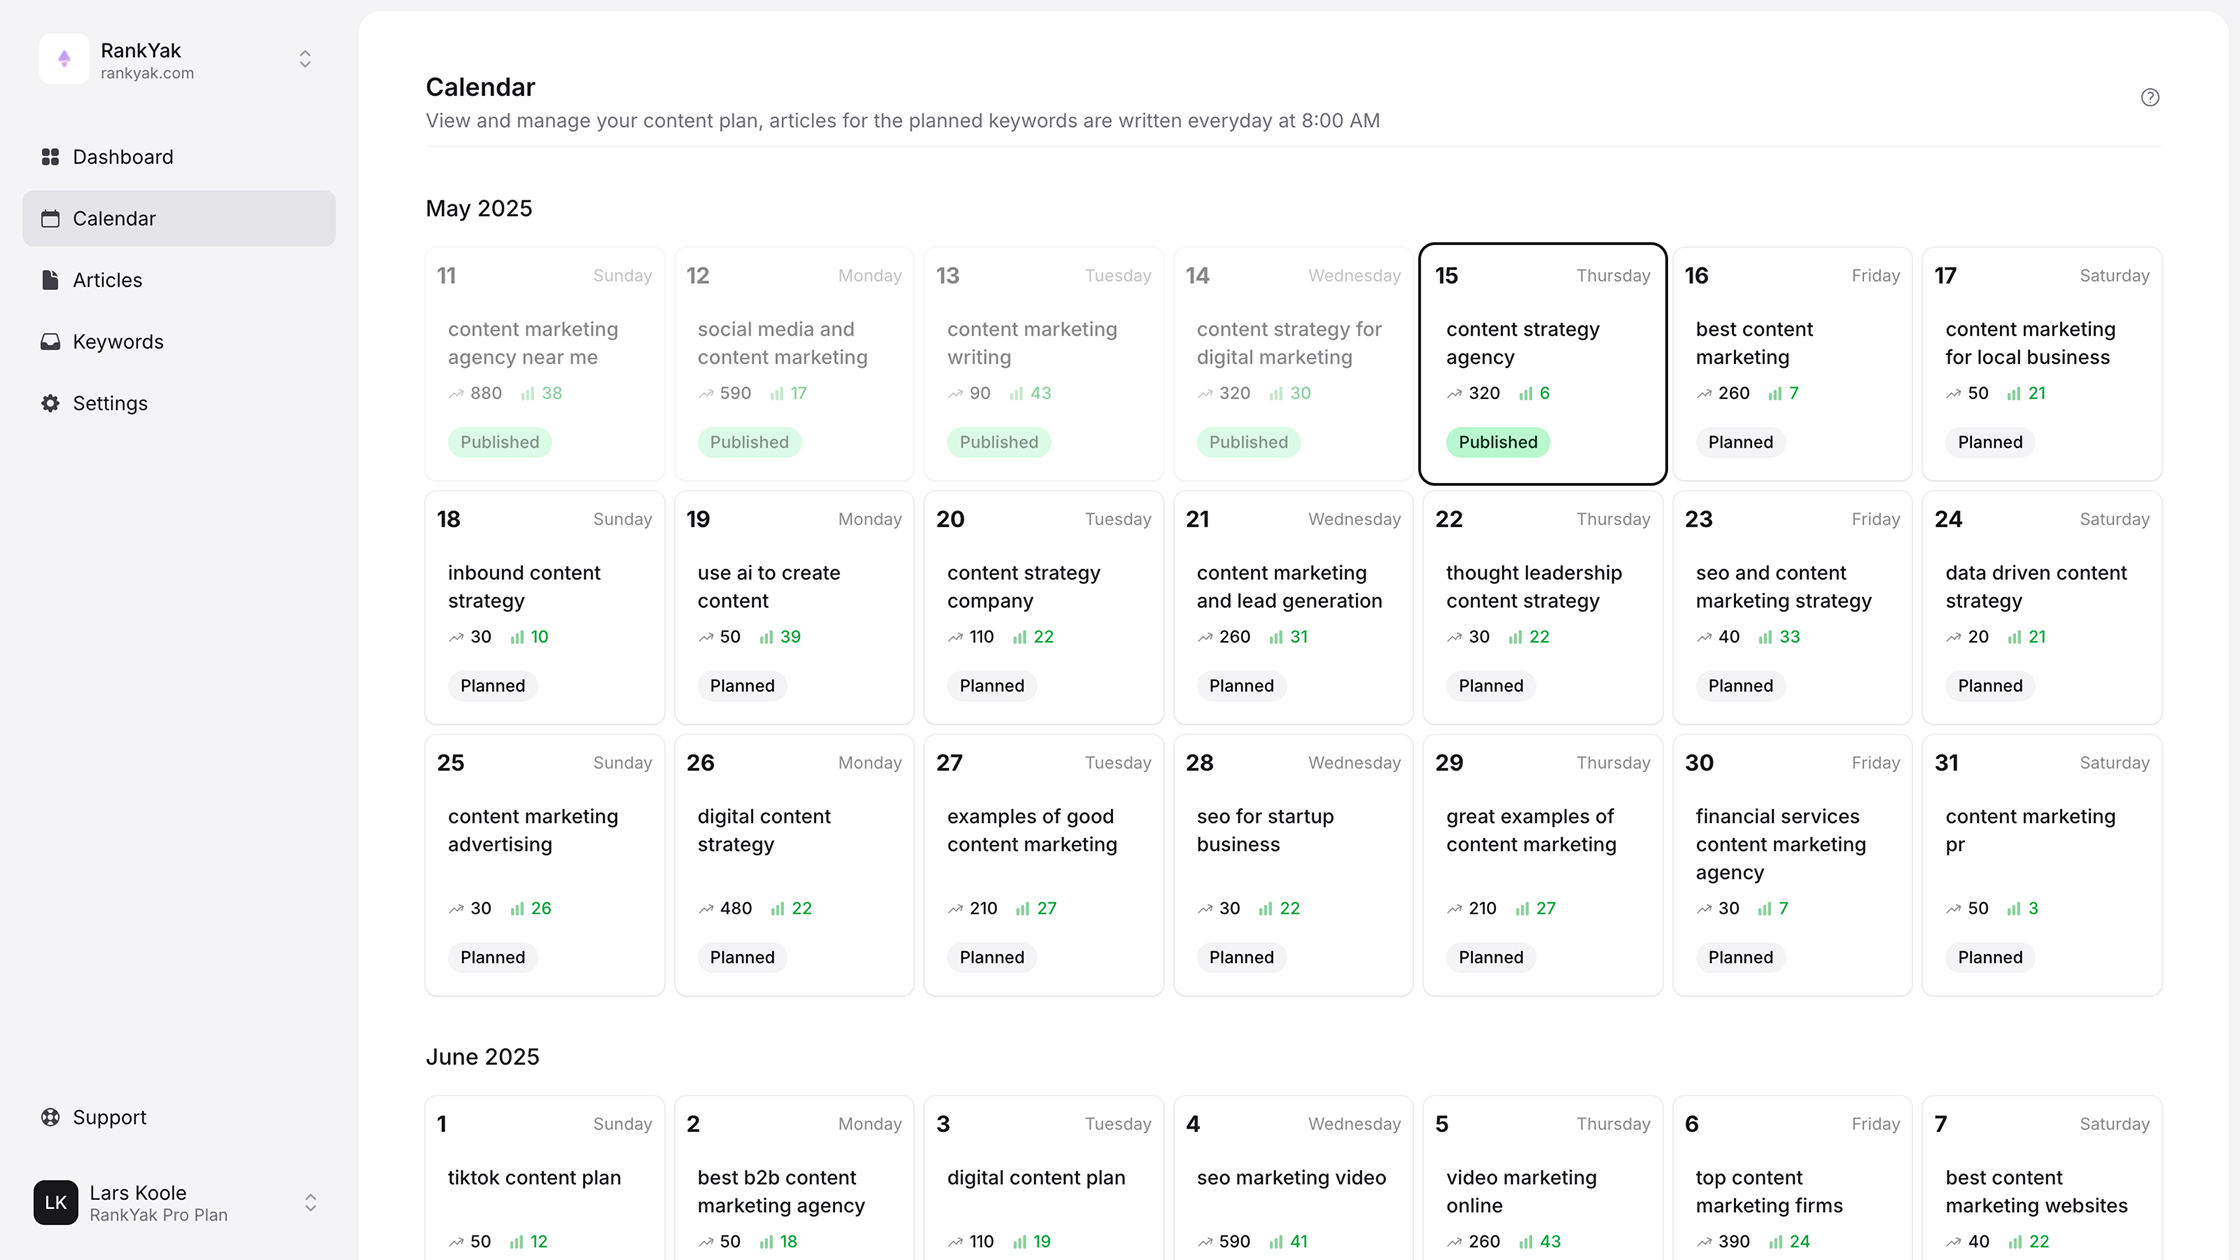
Add a rank tracker for keyword-level visibility
GA4 and Search Console give you aggregate data, but they don't always show clean keyword-level ranking history in a format that's easy to review over time. A dedicated rank tracker fills that gap. Look for a tool that tracks daily position changes, monitors competitor rankings, and supports keyword grouping by topic cluster so you can see how entire content categories perform, not just individual pages.
When you set up your rank tracker, import your target keywords in batches organized by topic. For example:
- Group 1: Product or service keywords (high commercial intent)
- Group 2: Informational keywords tied to your content plan
- Group 3: Brand keywords to monitor branded search growth
- Group 4: Competitor keywords you are actively targeting
Organizing keywords this way from the start makes it far easier to build reports later, since you can filter by group rather than sifting through hundreds of individual terms. Connect your rank tracker to GA4 via any available integration or export to keep all your performance data pointing in the same direction.
Step 4. Build reports that lead to clear decisions
Raw data doesn't drive decisions; organized, recurring reports do. The goal of a report isn't to display every metric you track. It's to surface the handful of numbers that tell you whether your SEO is moving in the right direction and flag what needs your attention. When you track SEO performance through a consistent reporting structure, you stop reacting to noise and start making deliberate adjustments based on clear trends.
Use a weekly reporting template
A weekly report doesn't need to be a lengthy document. The most useful format is a short, structured snapshot that you can complete in 15 minutes and review in five. Build it around the same metrics every week so you can compare periods at a glance. Use this template as your starting point:
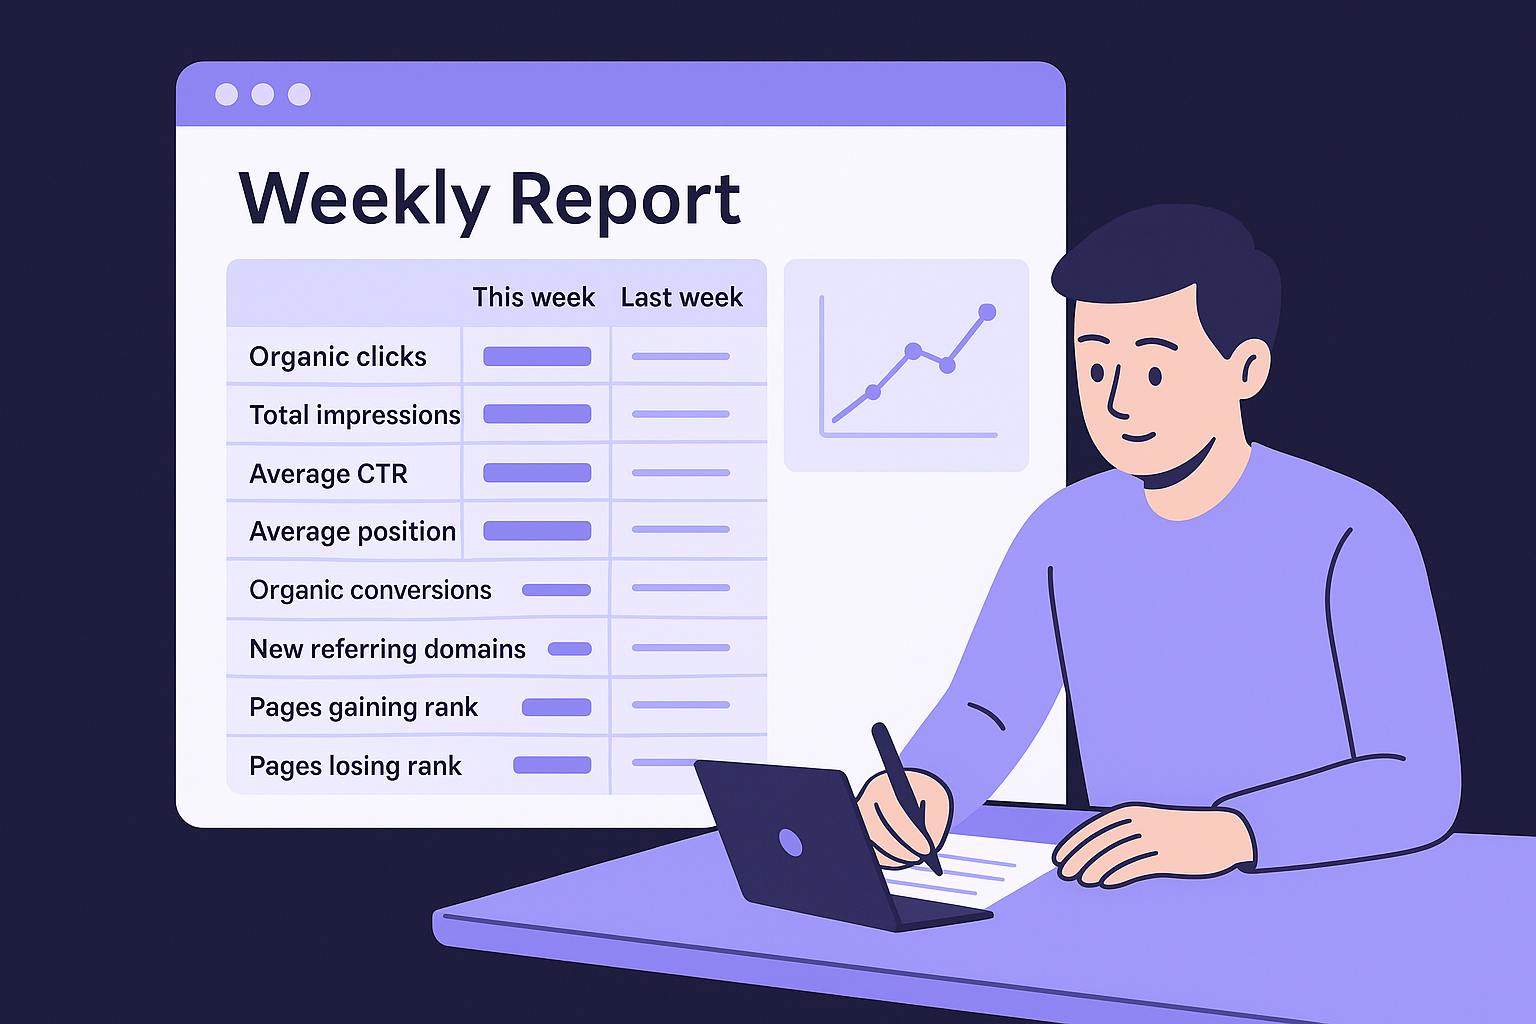
| Metric | This week | Last week | 30-day trend |
|---|---|---|---|
| Organic clicks | |||
| Total impressions | |||
| Average CTR | |||
| Average position | |||
| Organic conversions | |||
| New referring domains | |||
| Pages gaining rank | |||
| Pages losing rank |
Pull clicks, impressions, CTR, and average position directly from Google Search Console. Pull conversions from Google Analytics 4 filtered by the organic traffic source. Fill in referring domain data from your rank tracker or backlink tool. Once you complete this table three weeks in a row, patterns become visible without any additional analysis.
A report you run every week in 15 minutes beats a comprehensive report you build once a quarter and then abandon.
Turn data into action items
Every report should end with a short list of decisions, not just observations. The distinction matters: noting that average position dropped from 14 to 17 is an observation. Deciding to update the meta description and add two internal links to that page is an action item with a clear owner and deadline. Force yourself to write three action items at the bottom of every weekly report, even if the data looks positive.
When a page gains clicks but conversions stay flat, that signals a content relevance gap between what searchers expect and what the page delivers. When impressions rise but clicks stay flat, your listing itself needs work. Naming the specific fix, and the specific page, turns your reporting habit into actual SEO progress over time.
Common SEO tracking mistakes and how to fix them
Even with the right tools in place, it's easy to build habits that produce misleading data or send you chasing the wrong problems. Before you track SEO performance at scale, knowing where most sites go wrong saves you from building a flawed system that looks thorough but leads to bad decisions.
Checking rankings daily and reacting to noise
Keyword rankings fluctuate constantly. Checking your rankings every day and treating small swings as meaningful signals is one of the most common ways to waste time and make poor optimization choices. A page that drops from position 6 to position 8 on a Tuesday may be back at 6 by Thursday. Natural ranking volatility exists across almost every niche, and daily monitoring amplifies that noise rather than filtering it.
Review your ranking trends weekly at minimum, and look for direction over 30 to 90 day windows before making content changes based on position data.
Fix this by scheduling a single weekly ranking review rather than opening your tracker throughout the week. Use your tool's 30-day average position view instead of the daily snapshot, which smooths out the noise and shows you actual directional movement worth acting on.
Tracking too many metrics without a clear priority
Starting with 20 different metrics feels thorough but usually leads to analysis paralysis instead of clear decisions. When everything looks important, nothing gets fixed. Most site owners need a short list of four to six metrics reviewed consistently rather than a sprawling dashboard they skim and close.
Cut your active tracking list down to the metrics that map directly to your business goals from Step 1. If your goal is lead generation, your core weekly metrics are organic clicks, organic conversions, average position for your target keywords, and referring domain growth. Everything else moves to a monthly review at most.
Failing to segment organic traffic by page type
Treating all organic traffic as one block hides the information you need to improve. A blog post, a product page, and a service landing page all have different conversion goals and different success metrics. When you review them together, strong performance from one category masks weak performance in another.
Fix this in Google Analytics 4 by creating separate explorations for each page type using URL path filters. For example, filter paths containing /blog/ separately from paths containing /services/ or /products/ to see how each section of your site performs independently.
Next steps
You now have a complete framework to track SEO performance from goal-setting through weekly reporting and common mistake avoidance. The system only works if you actually build it. Start today by installing Google Search Console and Google Analytics 4, linking the two properties, and writing down your primary business goal with the single conversion event that measures it.
From there, run your weekly reporting template for four consecutive weeks before changing anything. You need a baseline before you can spot a trend. Once you have that baseline, your reports will tell you exactly which pages to update, which keywords to prioritize, and where your content gaps are.
If you want to skip the manual content production and let a system handle daily publishing automatically, try RankYak's automated SEO platform to see how it fits your workflow. The tracking framework here applies directly to everything it publishes.

Get Google and ChatGPT traffic on autopilot.
Start today and generate your first article within 15 minutes.
SEO revenue calculator
How much revenue is your website leaving on the table?
Take a quick quiz and see exactly how much organic revenue you're missing out on, along with personalized tips to fix it.
-
4 questions, under 1 minute
-
See traffic and revenue potential
-
No email required
Free · takes 1 minute · no signup needed
Question 1 of 4
Question 2 of 4
Question 3 of 4
Question 4 of 4
Your SEO growth potential
Extra visitors / month
after 6-12 months of consistent publishing
Revenue potential / year
at your niche's avg. conversion rate
Articles needed (12 mo)
to reach this traffic level
ROI with RankYak
at $99/mo ($1,188/year)
To hit that number, you'd need to:
- Build a topical authority strategy for your niche
- Research keywords & map out a full topical cluster
- Write, edit & publish an article every single day
- Build backlinks to the articles you publish
RankYak handles all of this automatically, every day.
* Estimates based on industry averages. Results vary by niche, competition, and domain authority. Most SEO results become visible after 3-6 months of consistent publishing.