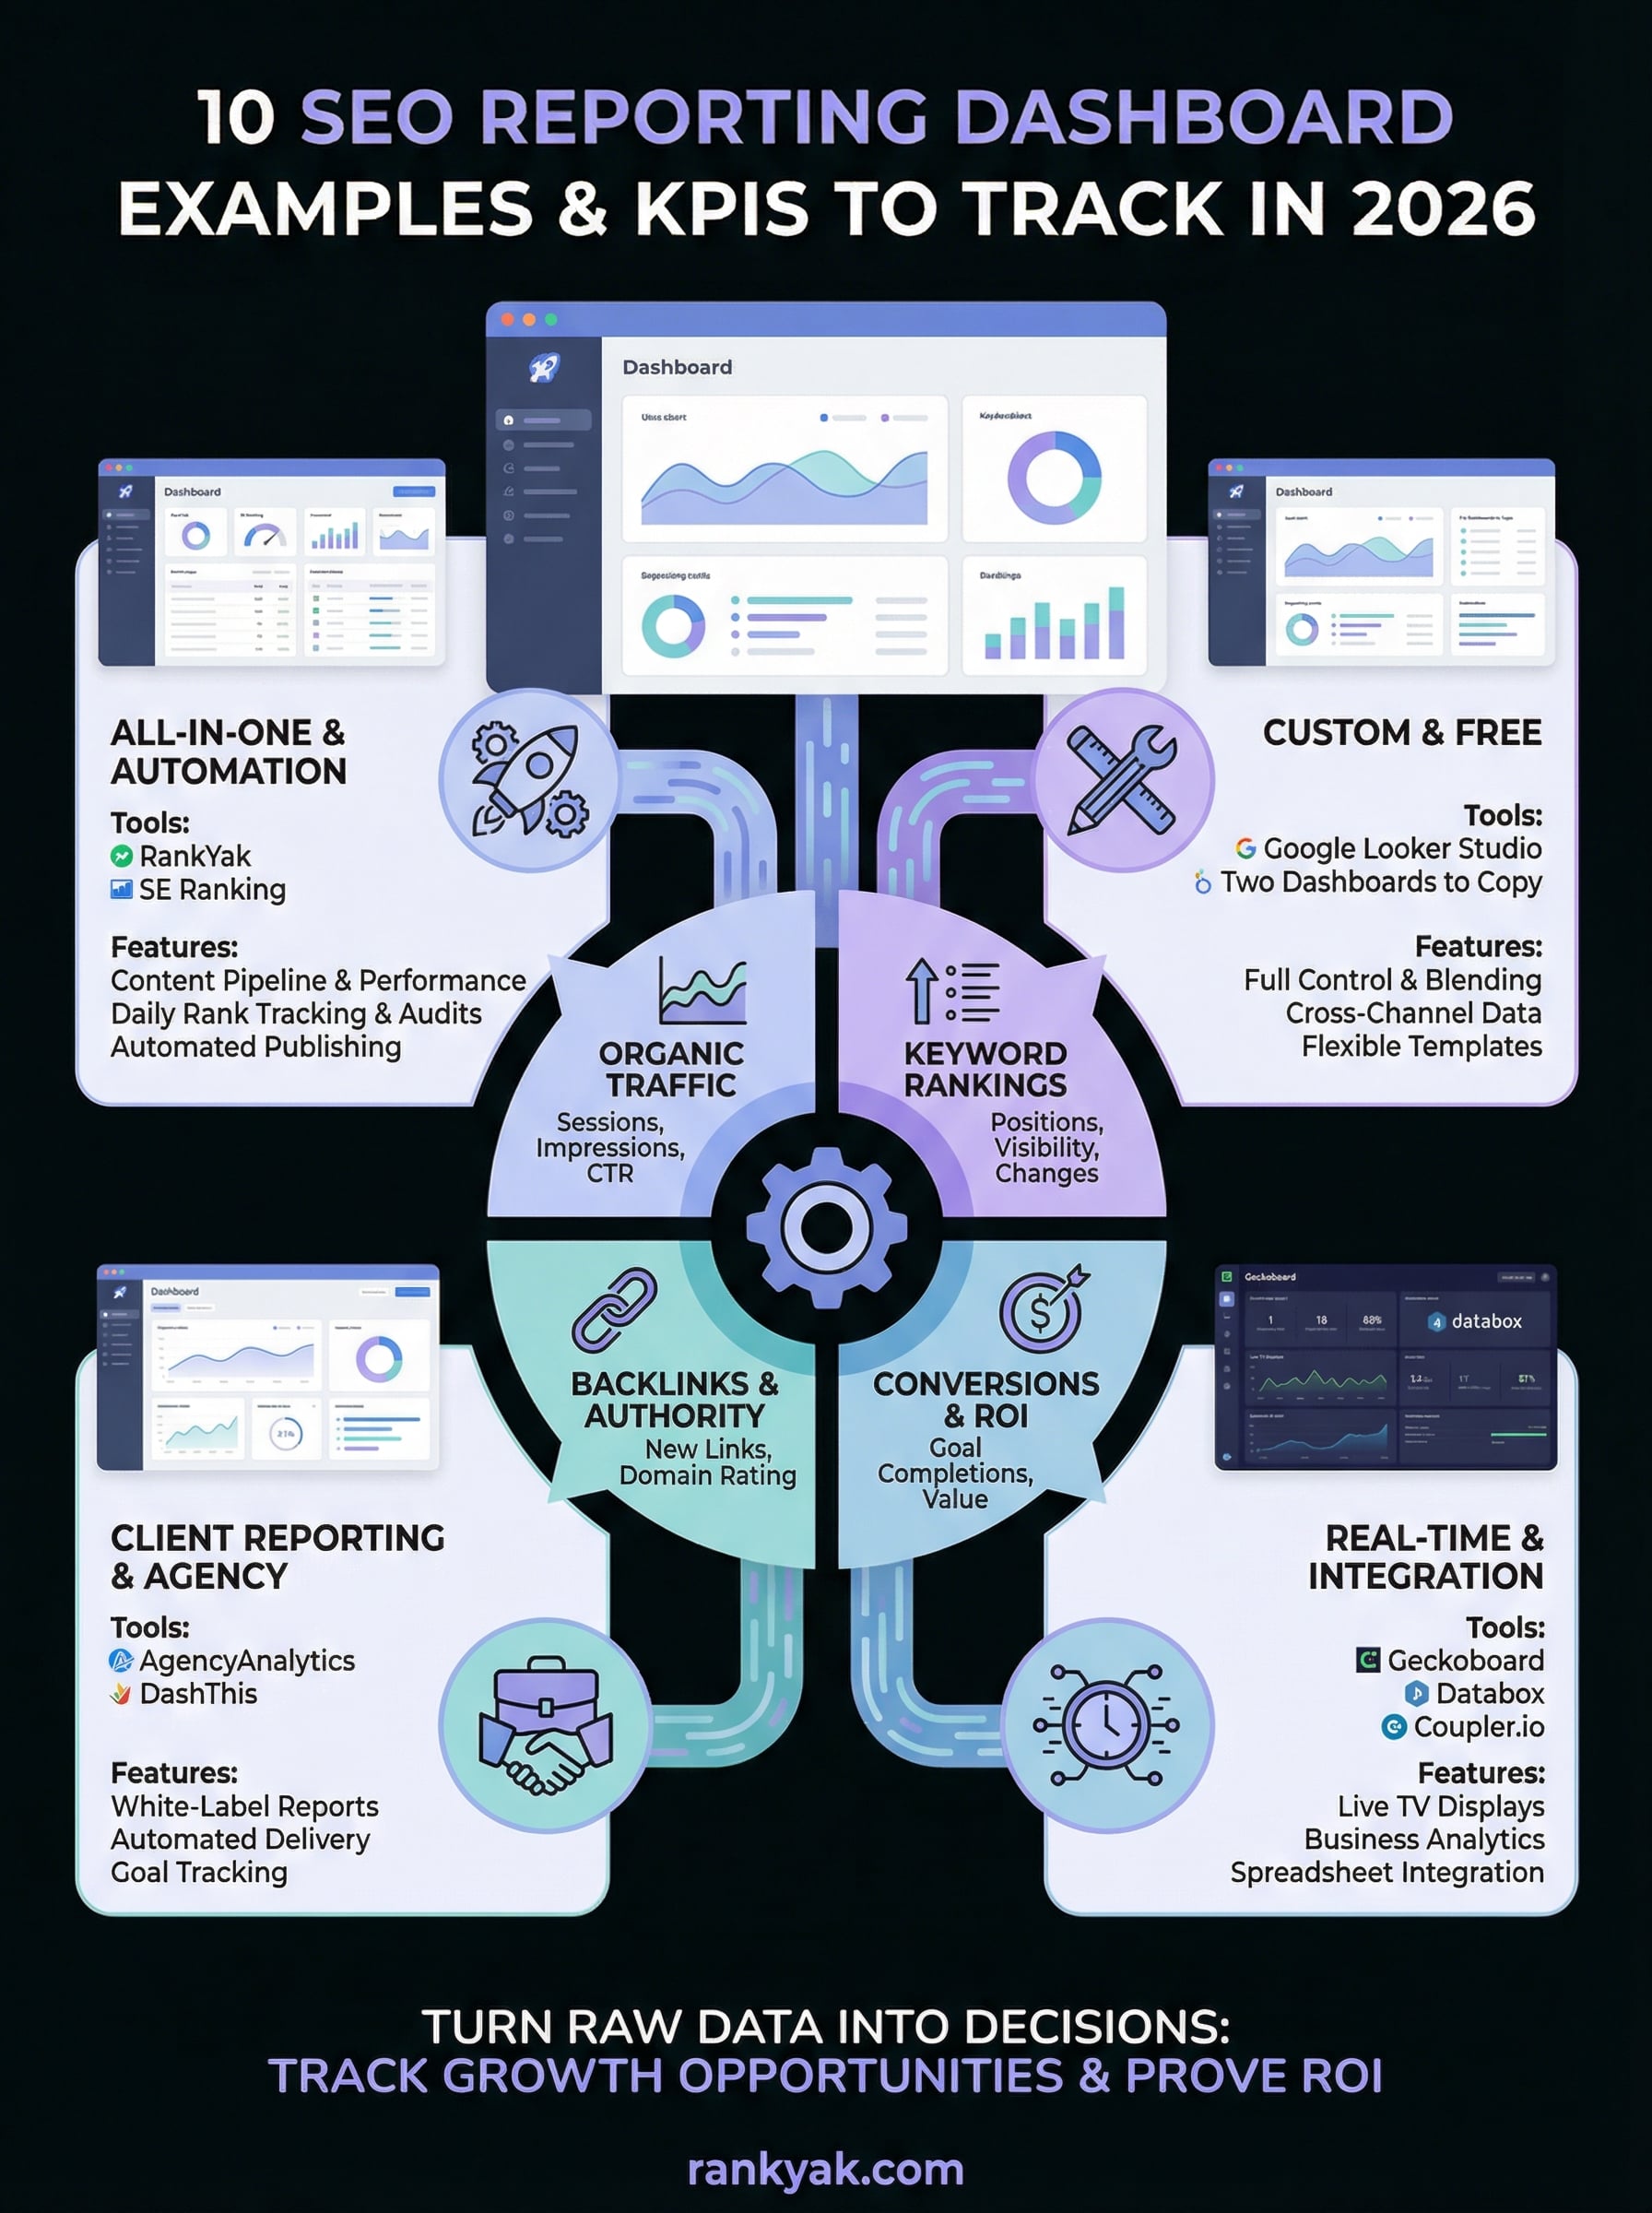
10 SEO Reporting Dashboard Examples & KPIs To Track in 2026

You're publishing content, building backlinks, and targeting the right keywords, but without a clear SEO reporting dashboard, you're essentially flying blind. Numbers scattered across Google Search Console, Analytics, and a handful of third-party tools don't tell a story on their own. You need a single view that pulls everything together and shows what's actually moving the needle.
That's where a well-built dashboard earns its keep. Whether you're reporting to clients, presenting to stakeholders, or just keeping yourself honest, the right dashboard turns raw data into decisions. But picking the right KPIs matters just as much as picking the right tool. Track the wrong metrics and you'll optimize for vanity numbers. Track the right ones and you'll spot growth opportunities before your competitors do, and prove ROI without the guesswork.
At RankYak, we automate the content side of SEO, from keyword discovery to daily publishing, so our users already have a steady stream of optimized articles hitting their sites. But measuring the impact of that content is where dashboards come in. That's why we put together this guide: 10 SEO reporting dashboard examples paired with the KPIs that actually deserve your attention in 2026. We'll cover free options, premium platforms, and a few setups you can build yourself, so you can find something that fits your workflow and budget.
1. RankYak
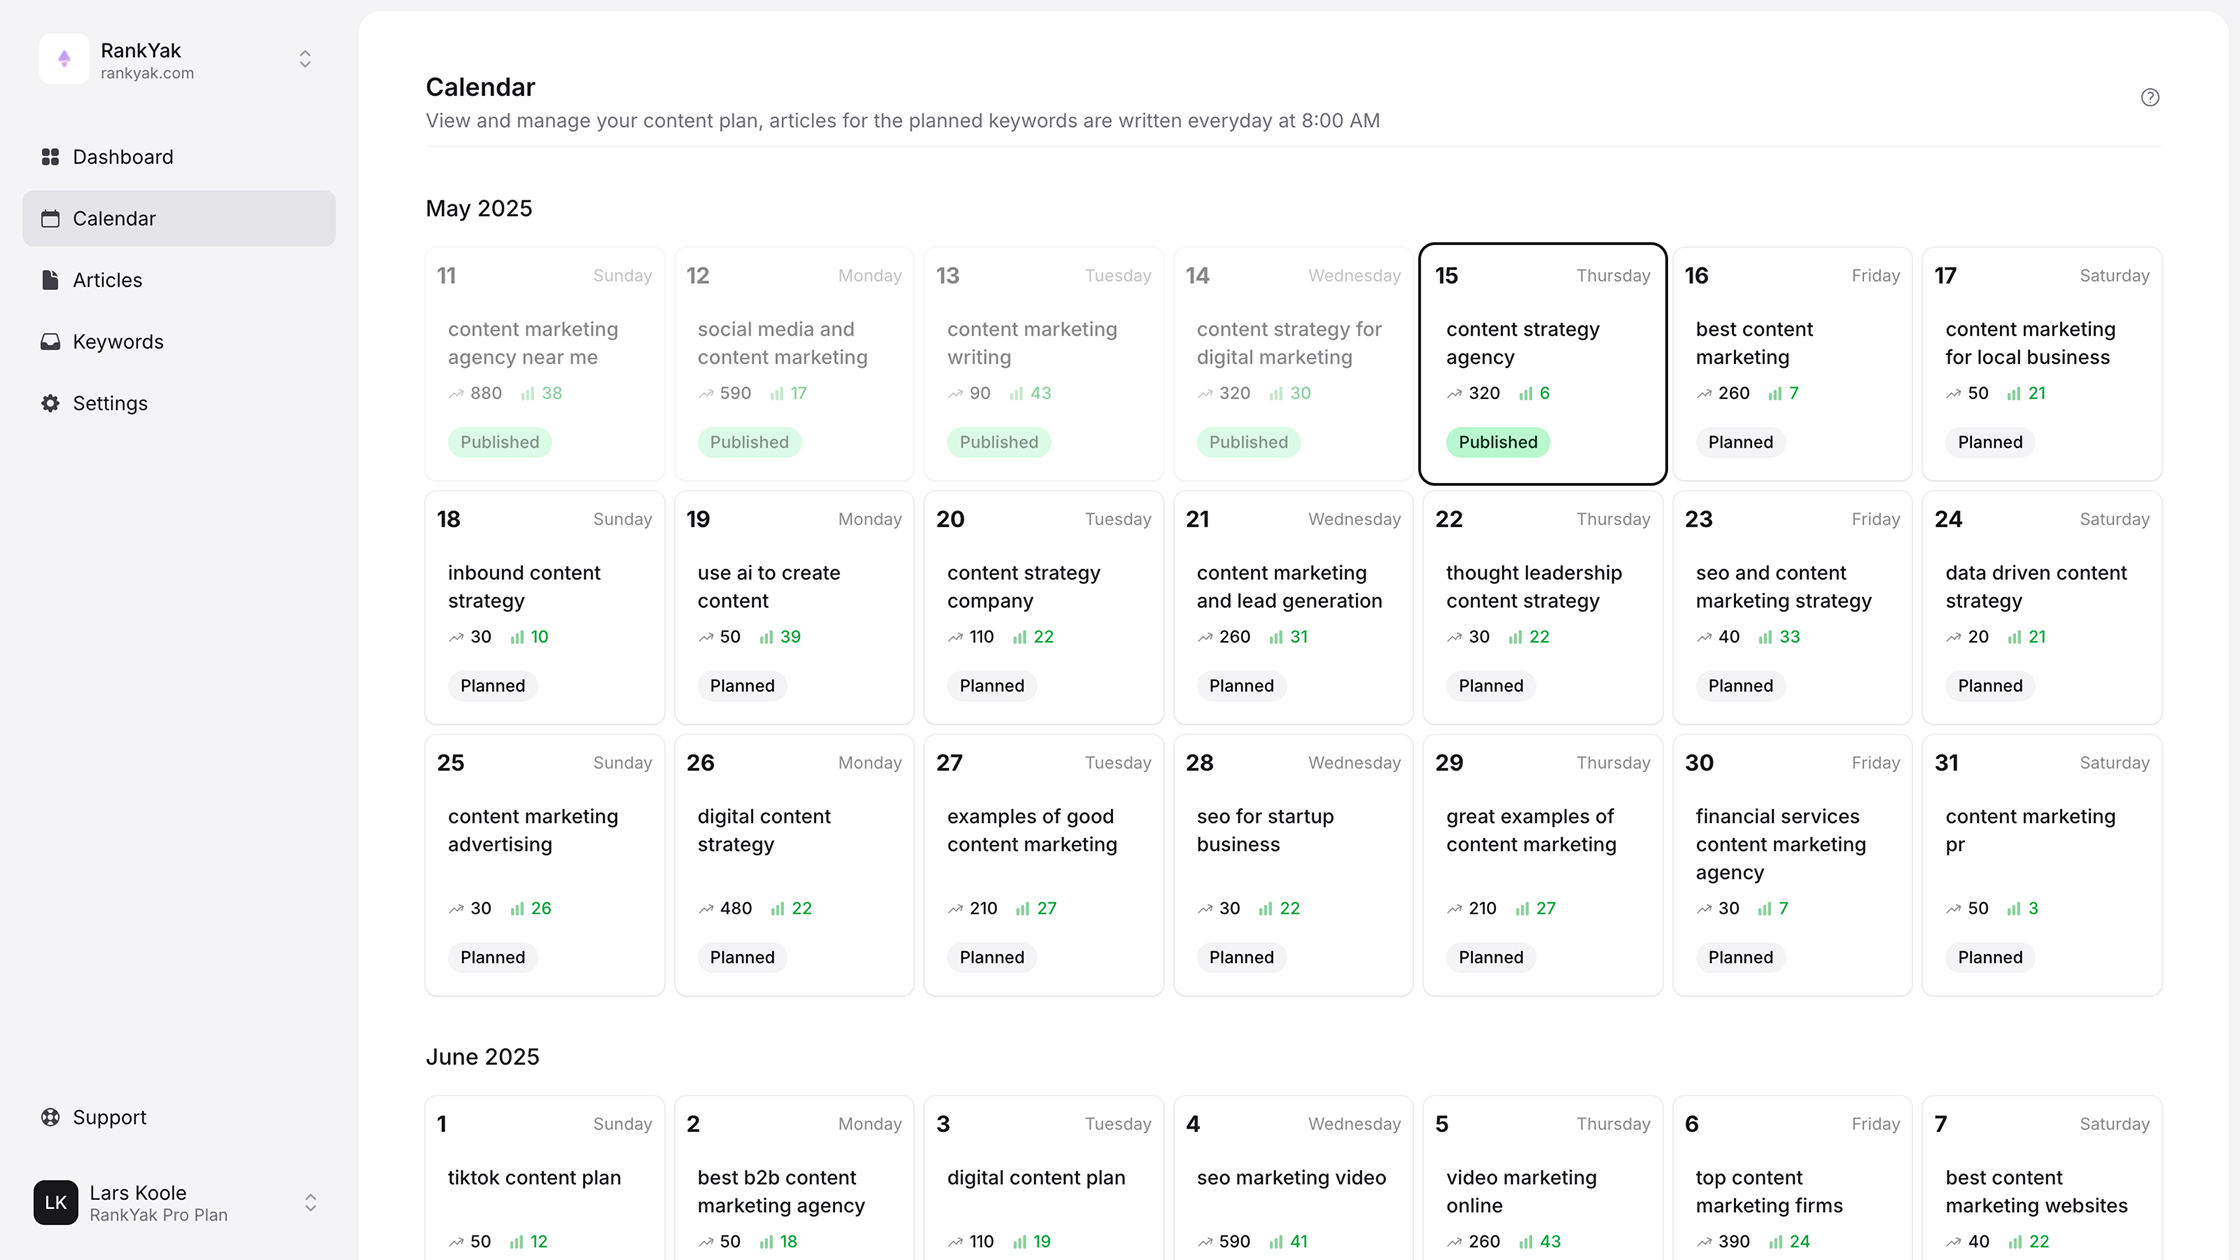
RankYak is an SEO automation platform built specifically for content-driven growth. You get daily keyword targeting, article generation, and automatic publishing, but the platform also gives you visibility into how that content performs over time. Instead of stitching together reports from five different tools, your SEO reporting dashboard inside RankYak keeps the content pipeline and performance data in one place.
What this dashboard helps you answer
RankYak's dashboard is built around one core question: is your content actually gaining traction in search? You can see which articles are live, which keywords they target, and how your overall content output tracks against your publishing schedule. This gives you a clear picture of whether your content velocity is translating into organic growth, so you're not left guessing weeks after publishing.
Consistent publishing paired with visibility into content performance is what separates sites that grow steadily from ones that plateau.
KPIs and widgets to include
The most valuable metrics to monitor inside RankYak center on content output and keyword coverage. Here are the specific KPIs worth tracking:
- Articles published per week and month
- Keywords targeted versus keywords ranking
- Organic impressions over time (via Google Search Console integration)
- Click-through rate by article
- Backlinks acquired through the built-in exchange network
Data sources to connect
RankYak pulls from your Google Search Console account to surface impression and click data directly inside the platform. For publishing, it connects natively to WordPress, Shopify, Webflow, Wix, and WordPress.com, so article performance ties back to your live site without any manual exports. You can also extend data flows through Zapier, Make, or the RankYak API and webhooks for custom reporting setups.
Who should use it
RankYak works best for small to medium-sized businesses and content marketers who want to automate their entire SEO workflow rather than manage a stack of separate tools. If you're running multiple websites, you can track each one under a single account with individual content plans and keyword targets.
Pricing and limits
RankYak costs $99 per month, which includes all features: keyword discovery, daily article generation up to 5,000 words, automatic publishing, backlink exchange, and multi-site management. You can test everything with a 3-day free trial, and you can cancel at any time, no questions asked.
2. Google Looker Studio
Google Looker Studio (formerly Data Studio) is a free reporting tool from Google that lets you build custom dashboards by connecting to a wide range of data sources. As a dedicated SEO reporting dashboard solution, it gives you full control over layout, chart types, and data blending, which means you can build exactly what you need rather than working within preset templates.
What this dashboard helps you answer
Looker Studio shines when you need to answer cross-channel performance questions. You can combine organic search data from Google Search Console with Google Analytics 4 session and conversion data in a single view, making it easy to see not just how many people find your content, but what they do after they land.
Blending multiple Google data sources inside one report removes the need to toggle between platforms every time a stakeholder asks a question.
KPIs and widgets to include
A solid Looker Studio SEO report typically includes organic clicks, impressions, average position, and CTR from Search Console, paired with sessions, bounce rate, and goal completions from GA4. Scorecards, time-series charts, and geo maps are the most useful widget types for communicating search trends clearly.
Data sources to connect
Looker Studio connects natively to Google Search Console, Google Analytics 4, Google Ads, and BigQuery. Third-party connectors are available through the Partner Connectors marketplace for tools like Ahrefs or SEMrush, though some carry additional fees.
Who should use it
This tool fits marketers and analysts who are comfortable building reports from scratch and want full customization without paying for a third-party platform.
Pricing and limits
Looker Studio is completely free to use with your Google account, with no feature caps or paid tiers.
3. Databox
Databox is a business analytics platform that pulls data from dozens of sources into a single, clean SEO reporting dashboard. It's built for teams that want pre-built templates and drag-and-drop customization without heavy technical setup. The mobile app lets you check key metrics without sitting at a desk, which matters when clients or stakeholders ask for quick updates.
What this dashboard helps you answer
Databox is particularly strong for goal tracking and performance benchmarking. You can compare your current period against past periods and set visible targets directly on the dashboard, so you can answer questions like "are we trending toward hitting our organic traffic goal this quarter?" without exporting anything to a spreadsheet.
Setting visual targets on a live dashboard keeps your team focused on outcomes rather than just monitoring raw numbers.
KPIs and widgets to include
For an SEO-focused setup, the most useful metrics include organic sessions, keyword rankings, and average position, alongside backlink count and impressions. Databox supports scorecards, bar charts, and goal progress indicators, which work well for monthly stakeholder reports.
Data sources to connect
Databox connects to Google Analytics 4 and Google Search Console natively, plus third-party tools including Ahrefs, SEMrush, and Moz. Most integrations require only OAuth authorization to activate, so setup takes minutes rather than hours.
Who should use it
Databox suits marketing teams and agencies that need to track multiple campaigns and want pre-built SEO templates they can deploy quickly without custom report builds from scratch.
Pricing and limits
Databox offers a free plan with limited data sources and three paid tiers starting at $47 per month, scaling based on the number of data sources and users you add.
4. Geckoboard
Geckoboard is a real-time dashboard tool built primarily for displaying live data on office screens and TVs. While it's not an SEO-specific platform, it works well as a focused SEO reporting dashboard when you need your team to stay aware of key metrics throughout the day without logging into multiple tools.
What this dashboard helps you answer
Geckoboard answers one question well: what's happening right now? It's designed for visibility rather than deep analysis, so it works best when you want your whole team to see whether organic traffic is up or down compared to yesterday or last week, all at a glance from across the room.
A live dashboard on a shared screen builds team accountability around SEO performance without requiring anyone to pull up a report.
KPIs and widgets to include
For an SEO-focused board, prioritize organic sessions, impressions, and average ranking position as your headline metrics. You can add click-through rate and page-level traffic widgets to surface which content drives the most visits right now.
Data sources to connect
Geckoboard connects natively to Google Analytics 4 and Google Search Console out of the box. It also supports connections through Zapier for pulling data from tools that fall outside its native integration library.
Who should use it
Geckoboard suits marketing teams and small agencies that want a simple, always-on display rather than a full reporting suite. If your team works in a shared office, the TV dashboard format makes it easy to keep everyone on the same page without scheduling regular report reviews.
Pricing and limits
Geckoboard starts at $49 per month for up to five users, with higher tiers available for larger teams and additional data sources.
5. SE Ranking
SE Ranking is an all-in-one SEO platform that combines rank tracking, site auditing, competitor research, and reporting inside a single tool. Unlike Looker Studio or Geckoboard, which require you to pull data in from external sources, SE Ranking collects its own data directly, so your SEO reporting dashboard reflects what SE Ranking measures rather than relying entirely on third-party imports.
What this dashboard helps you answer
SE Ranking gives you a clear answer to how your keyword rankings are moving over time and how your site stacks up against direct competitors. You can track specific keyword positions daily, spot drops before they become real traffic losses, and compare your organic visibility against competing domains side by side.
Daily rank tracking inside the same platform where you manage your SEO campaign keeps your reporting and your strategy in sync.
KPIs and widgets to include
The metrics that SE Ranking tracks best include keyword position changes, organic traffic estimates, domain trust scores, and site health scores from the built-in audit tool. You can also pull in backlink counts and new link acquisition data from SE Ranking's own link index.
Data sources to connect
SE Ranking connects to Google Analytics 4 and Google Search Console to supplement its own crawl and rank data with real traffic and impression figures from your actual site.
Who should use it
This platform fits freelance SEOs and small agencies who want one subscription covering rank tracking, auditing, and client reporting without managing separate tools.
Pricing and limits
SE Ranking starts at $65 per month, with pricing scaling based on the number of keywords you track and the frequency of rank checks.
6. DashThis
DashThis is a dedicated reporting automation tool built to save agencies and marketers time on recurring client reports. Instead of rebuilding the same SEO reporting dashboard from scratch each month, you create a template once and let DashThis refresh the data automatically on your chosen schedule.
What this dashboard helps you answer
DashThis answers the question every agency client asks: "what did you actually accomplish this month?" The platform is built around shareable, white-labeled reports that non-technical clients can read without needing to understand the underlying data sources. You can schedule automatic email delivery so reports land in a client's inbox without any manual effort on your end.
Automating delivery of client reports removes one of the most time-consuming tasks in agency SEO work.
KPIs and widgets to include
DashThis comes with pre-built widget templates for organic traffic, keyword rankings, impressions, and backlink growth. You can add goal completion metrics and traffic source breakdowns to give clients a complete picture of how search performance connects to actual business outcomes.
Data sources to connect
DashThis connects natively to Google Search Console, Google Analytics 4, and Google Ads. It also supports integrations with third-party SEO tools through CSV uploads and API connections, giving you flexibility when your data lives outside the Google ecosystem.
Who should use it
DashThis fits agencies and freelance SEO consultants who manage multiple client accounts and need a fast, repeatable way to produce polished monthly reports without rebuilding dashboards each cycle.
Pricing and limits
DashThis starts at $49 per month for up to three dashboards, with higher tiers scaling based on the number of dashboards you need.
7. AgencyAnalytics
AgencyAnalytics is a dedicated client reporting platform built for SEO and digital marketing agencies. It combines rank tracking, site auditing, and automated reporting into a single workspace, so your team manages every client's SEO reporting dashboard without juggling separate subscriptions or rebuilding reports from scratch each month.
What this dashboard helps you answer
AgencyAnalytics is designed to answer the questions your clients actually ask: "Is my site ranking better?" and "Where is my traffic coming from?" You get a centralized view of each client's organic performance, with white-label options that let you present the data under your own brand rather than a third-party tool's interface.
Presenting client reports under your own brand builds trust and reinforces your agency's value at every touchpoint.
KPIs and widgets to include
The platform includes pre-built widgets for organic traffic, keyword rankings, backlink counts, and site health scores. You can also pull in conversion and goal data alongside search metrics, giving clients a complete picture of how their SEO investment connects to real business results.
Data sources to connect
AgencyAnalytics connects natively to Google Search Console and Google Analytics 4, plus third-party SEO tools including Ahrefs, SEMrush, and Moz for ranking and backlink data.
Who should use it
AgencyAnalytics suits digital marketing agencies that manage multiple client accounts and want white-labeled, automated reporting without building dashboards from scratch each reporting cycle.
Pricing and limits
Pricing starts at $59 per month for up to five client campaigns, with higher tiers scaling based on the number of campaigns and team members you need.
8. Coupler.io
Coupler.io is a data integration and reporting platform that pulls data from multiple sources into spreadsheets and dashboards on a set schedule. It's not an SEO-specific tool, but it works well as a flexible SEO reporting dashboard builder when you need full control over how your data is structured and displayed.
What this dashboard helps you answer
Coupler.io helps you answer how your SEO data connects to broader business metrics in a format your whole team can actually use. By routing data directly into Google Sheets or Looker Studio, you can build custom views that surface organic performance trends without copying numbers out of multiple platforms by hand.
Automating data pulls into a spreadsheet removes the repetitive manual work of exporting metrics from different tools every single week.
KPIs and widgets to include
For SEO reporting, focus on organic sessions, keyword rankings, and backlink growth alongside any revenue or conversion data you pull in from your CRM or ecommerce platform. Coupler.io supports scheduled data refreshes, so your dashboard reflects current numbers without requiring you to trigger anything manually.
Data sources to connect
Coupler.io connects to Google Analytics 4, Google Search Console, and Google Ads natively, plus a library of third-party integrations including Ahrefs and SEMrush. Your data lands in Google Sheets, Looker Studio, or Power BI depending on which reporting environment your team already uses.
Who should use it
Coupler.io fits analysts and technical marketers who want automated data pipelines into spreadsheets or existing BI tools without writing custom scripts or maintaining API connections on their own.
Pricing and limits
Coupler.io offers a free plan with limited refresh frequency, and paid plans start at $49 per month, scaling based on the number of data flows and refresh intervals you need.
9. Two Dashboards to Copy in Any Tool
Not every team needs a dedicated SEO reporting tool. Sometimes two well-structured templates you can rebuild inside whatever platform you already use are all you need to stay on top of performance and communicate results clearly.
What this dashboard helps you answer
The first template is a client-facing monthly summary that covers organic clicks, impressions, average position, and top-performing pages. The second is an internal rank-tracking board that monitors keyword position changes, site health scores, and backlink growth week over week.
KPIs and widgets to include
For the client dashboard, keep it tight with six or fewer headline metrics: organic sessions, impressions, CTR, average position, top five pages by clicks, and goal completions. For the internal board, add keyword position change, crawl error count, and new backlinks acquired during the current week.
Keeping your client dashboard focused on business outcomes rather than technical metrics makes reports far easier to act on.
Data sources to connect
Both templates pull from Google Search Console and Google Analytics 4 as their core data sources. Your internal board benefits from adding a third-party rank tracker for daily position updates that Search Console alone does not surface reliably.
Who should use it
These templates work for any SEO practitioner who prefers building their own setup over paying for a purpose-built platform. If you already use Looker Studio or a spreadsheet, you can replicate both boards without switching tools.
Pricing and limits
Since these are templates rather than tools, the cost depends entirely on the platform you choose. Both Looker Studio and Google Sheets are free, meaning you can get a solid SEO reporting dashboard running at no added cost.
What to do next
You now have ten concrete options for building an SEO reporting dashboard that fits your workflow, whether you want a free setup in Looker Studio, a polished client-facing tool like AgencyAnalytics, or a fully automated content platform like RankYak. The right choice depends on who you're reporting to and how much time you want to spend managing the process versus reading the results.
Start by picking one dashboard and connecting your Google Search Console and GA4 accounts this week. Get your core KPIs visible before adding more data sources. A simple, consistent report you actually review beats a complex one you ignore.
If you want to stop worrying about content output and focus on tracking the results instead, RankYak handles the entire publishing pipeline for you, from keyword discovery to daily article generation. Start your free 3-day trial and see what consistent, automated content does for your organic traffic.

Get Google and ChatGPT traffic on autopilot.
Start today and generate your first article within 15 minutes.
SEO revenue calculator
How much revenue is your website leaving on the table?
Take a quick quiz and see exactly how much organic revenue you're missing out on, along with personalized tips to fix it.
-
4 questions, under 1 minute
-
See traffic and revenue potential
-
No email required
Free · takes 1 minute · no signup needed
Question 1 of 4
Question 2 of 4
Question 3 of 4
Question 4 of 4
Your SEO growth potential
Extra visitors / month
after 6-12 months of consistent publishing
Revenue potential / year
at your niche's avg. conversion rate
Articles needed (12 mo)
to reach this traffic level
ROI with RankYak
at $99/mo ($1,188/year)
To hit that number, you'd need to:
- Build a topical authority strategy for your niche
- Research keywords & map out a full topical cluster
- Write, edit & publish an article every single day
- Build backlinks to the articles you publish
RankYak handles all of this automatically, every day.
* Estimates based on industry averages. Results vary by niche, competition, and domain authority. Most SEO results become visible after 3-6 months of consistent publishing.