Google Trends For Keyword Research: A Step-By-Step Guide

Most keyword research starts and ends with search volume and competition scores. But those metrics only tell you what happened, not what's happening right now. Google Trends for keyword research gives you something most SEO tools can't: a real-time view of how interest in a topic is rising, falling, or shifting seasonally. It's free, surprisingly powerful, and widely underused by the people who'd benefit from it most, small business owners and marketers trying to get ahead of their competitors in search.
The problem is that Google Trends wasn't built as a keyword research tool. Its interface is simple, but knowing how to extract actionable SEO insights from it takes a bit of guidance. Which filters actually matter? How do you compare keywords effectively? When should you trust a trend line, and when should you ignore it? These are the questions that separate casual users from people who use Trends to make smarter content decisions.
This guide walks you through the entire process step by step, from setting up your first query to identifying seasonal opportunities and validating keyword ideas before you commit to creating content around them. Whether you're doing this manually or using a platform like RankYak to automate your keyword discovery and content pipeline, understanding how Google Trends works will sharpen your ability to target the right topics at the right time. Let's get into it.
What Google Trends shows and what it does not
Google Trends gives you relative search interest, not raw search volume. When you look at a trend line, the numbers range from 0 to 100. That score represents how popular a search term is compared to its peak popularity within the time frame and region you've selected. A score of 100 marks peak interest during that period. A score of 50 means the term was half as popular as its peak. A score of 0 means there wasn't enough data to report.
Understanding this distinction before you start is critical: a score of 100 does not mean a term gets a million searches. It means that point in time saw the highest relative interest in your selected context.
What Google Trends actually measures
Google Trends pulls data from actual Google searches and normalizes it across location, time, and category to make comparisons fair. When you use Google Trends for keyword research, you're working with a sample of search data, not a complete count. This makes the data directional rather than precise, and it's genuinely useful for spotting patterns, comparing competing terms, and identifying rising topics before they become saturated.
The tool also separates "Topics" from "Search Queries." Topics group related searches under one concept, regardless of spelling, phrasing, or language. Queries show the exact strings people typed into Google. Both have a clear role in keyword research, and you'll put each to work in Step 2 of this guide.
Where Google Trends falls short
Google Trends does not give you absolute search volume, keyword difficulty, or click-through rate data. It will not tell you whether a keyword is easy or hard to rank for, and it will not show you whether searchers actually click on any results. For those metrics, you need a dedicated keyword research tool running alongside Trends, not instead of it.
The platform also struggles with low-volume keywords. If a term doesn't generate enough searches in your selected time frame or region, Trends will either produce erratic data or return nothing at all. This makes it a strong fit for mid-to-high volume topics and a weak fit for niche long-tail terms that draw minimal traffic. Knowing this boundary upfront saves you from misreading gaps in the data as signals about a keyword's potential.
Step 1. Set up your Google Trends research view
Before you type a single keyword, you need to configure your filters. Google Trends defaults to worldwide search data for the past 12 months, which is rarely the right starting point for most keyword research tasks. Adjusting these settings upfront ensures you're looking at data that actually reflects your target audience, not a global average that dilutes regional patterns and makes results harder to act on.
Choose your filters before you type anything
The five filters across the top of the interface control everything you see. Set them in this order before you enter any search term:
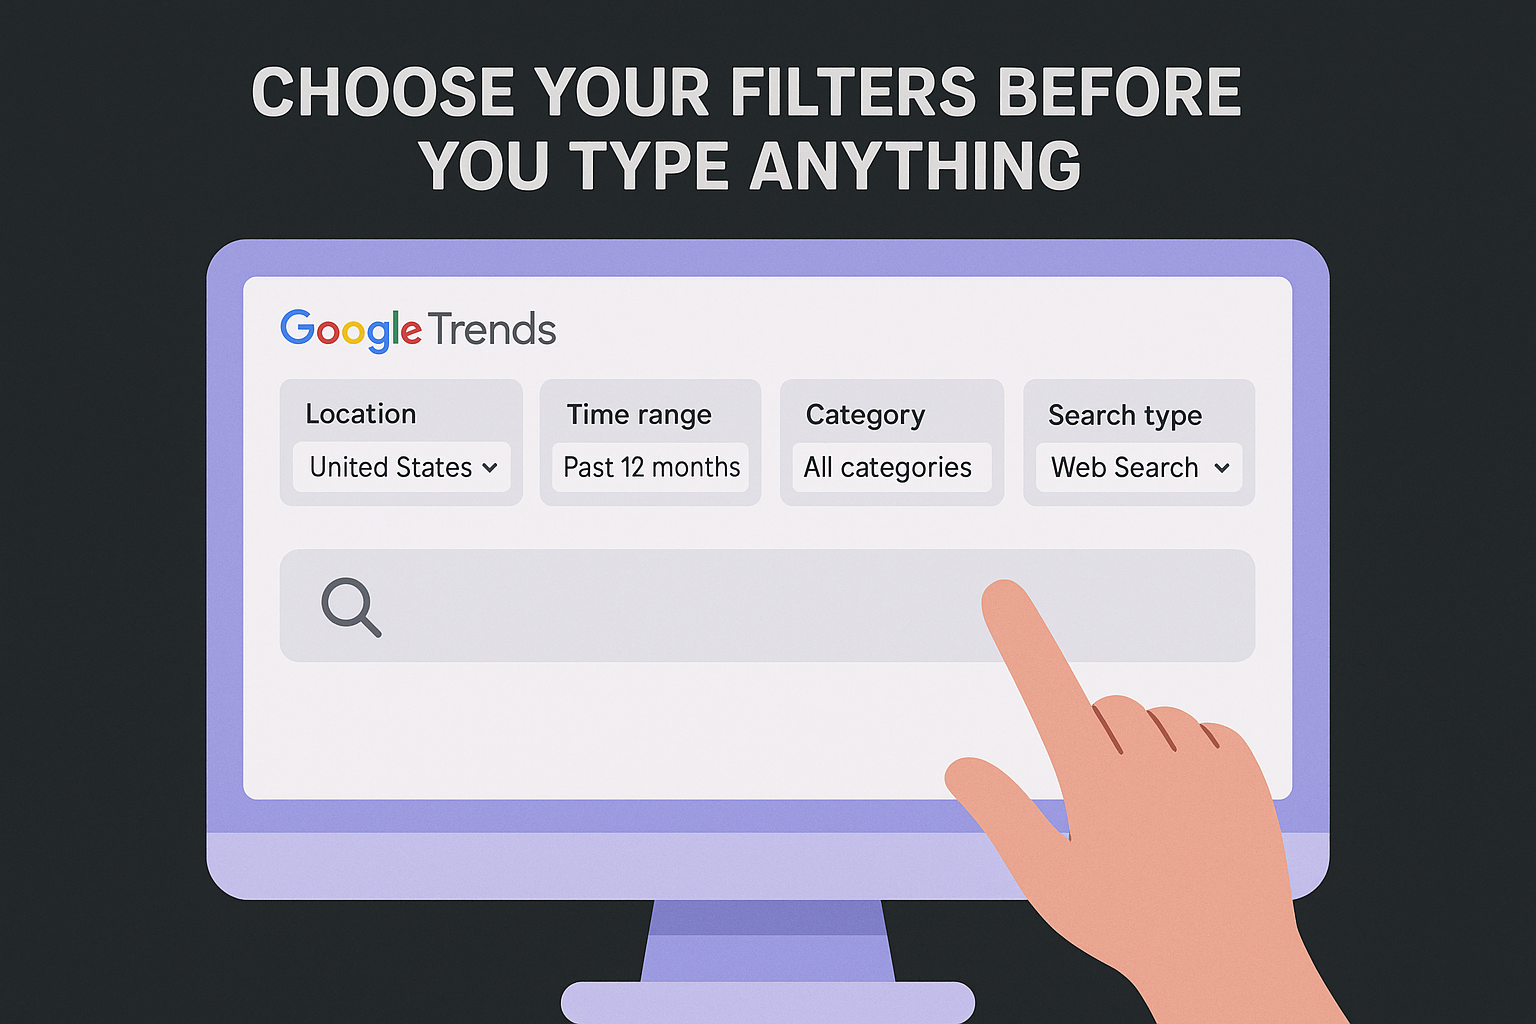
- Location: Set this to your target country (for example, "United States") unless you're running a multilingual strategy and need broader data.
- Time range: Start with "Past 12 months" to capture a full seasonal picture. Narrow to "Past 90 days" if you're tracking a fast-moving trend.
- Category: Leave this on "All categories" for your first pass. Narrow it only if your term carries different meanings across industries.
- Search type: Keep this on "Web Search" for standard keyword research. Switch to "YouTube Search" if your content plan includes video.
Setting the wrong location or time range is the single most common mistake people make when using Google Trends for keyword research, and it produces misleading results that push your content strategy in the wrong direction.
Once your filters are in place, your results will reflect a realistic view of how real users in your market are actually searching. This setup takes under a minute and makes every comparison you run afterward far more accurate and useful.
Step 2. Generate keyword ideas with topics and queries
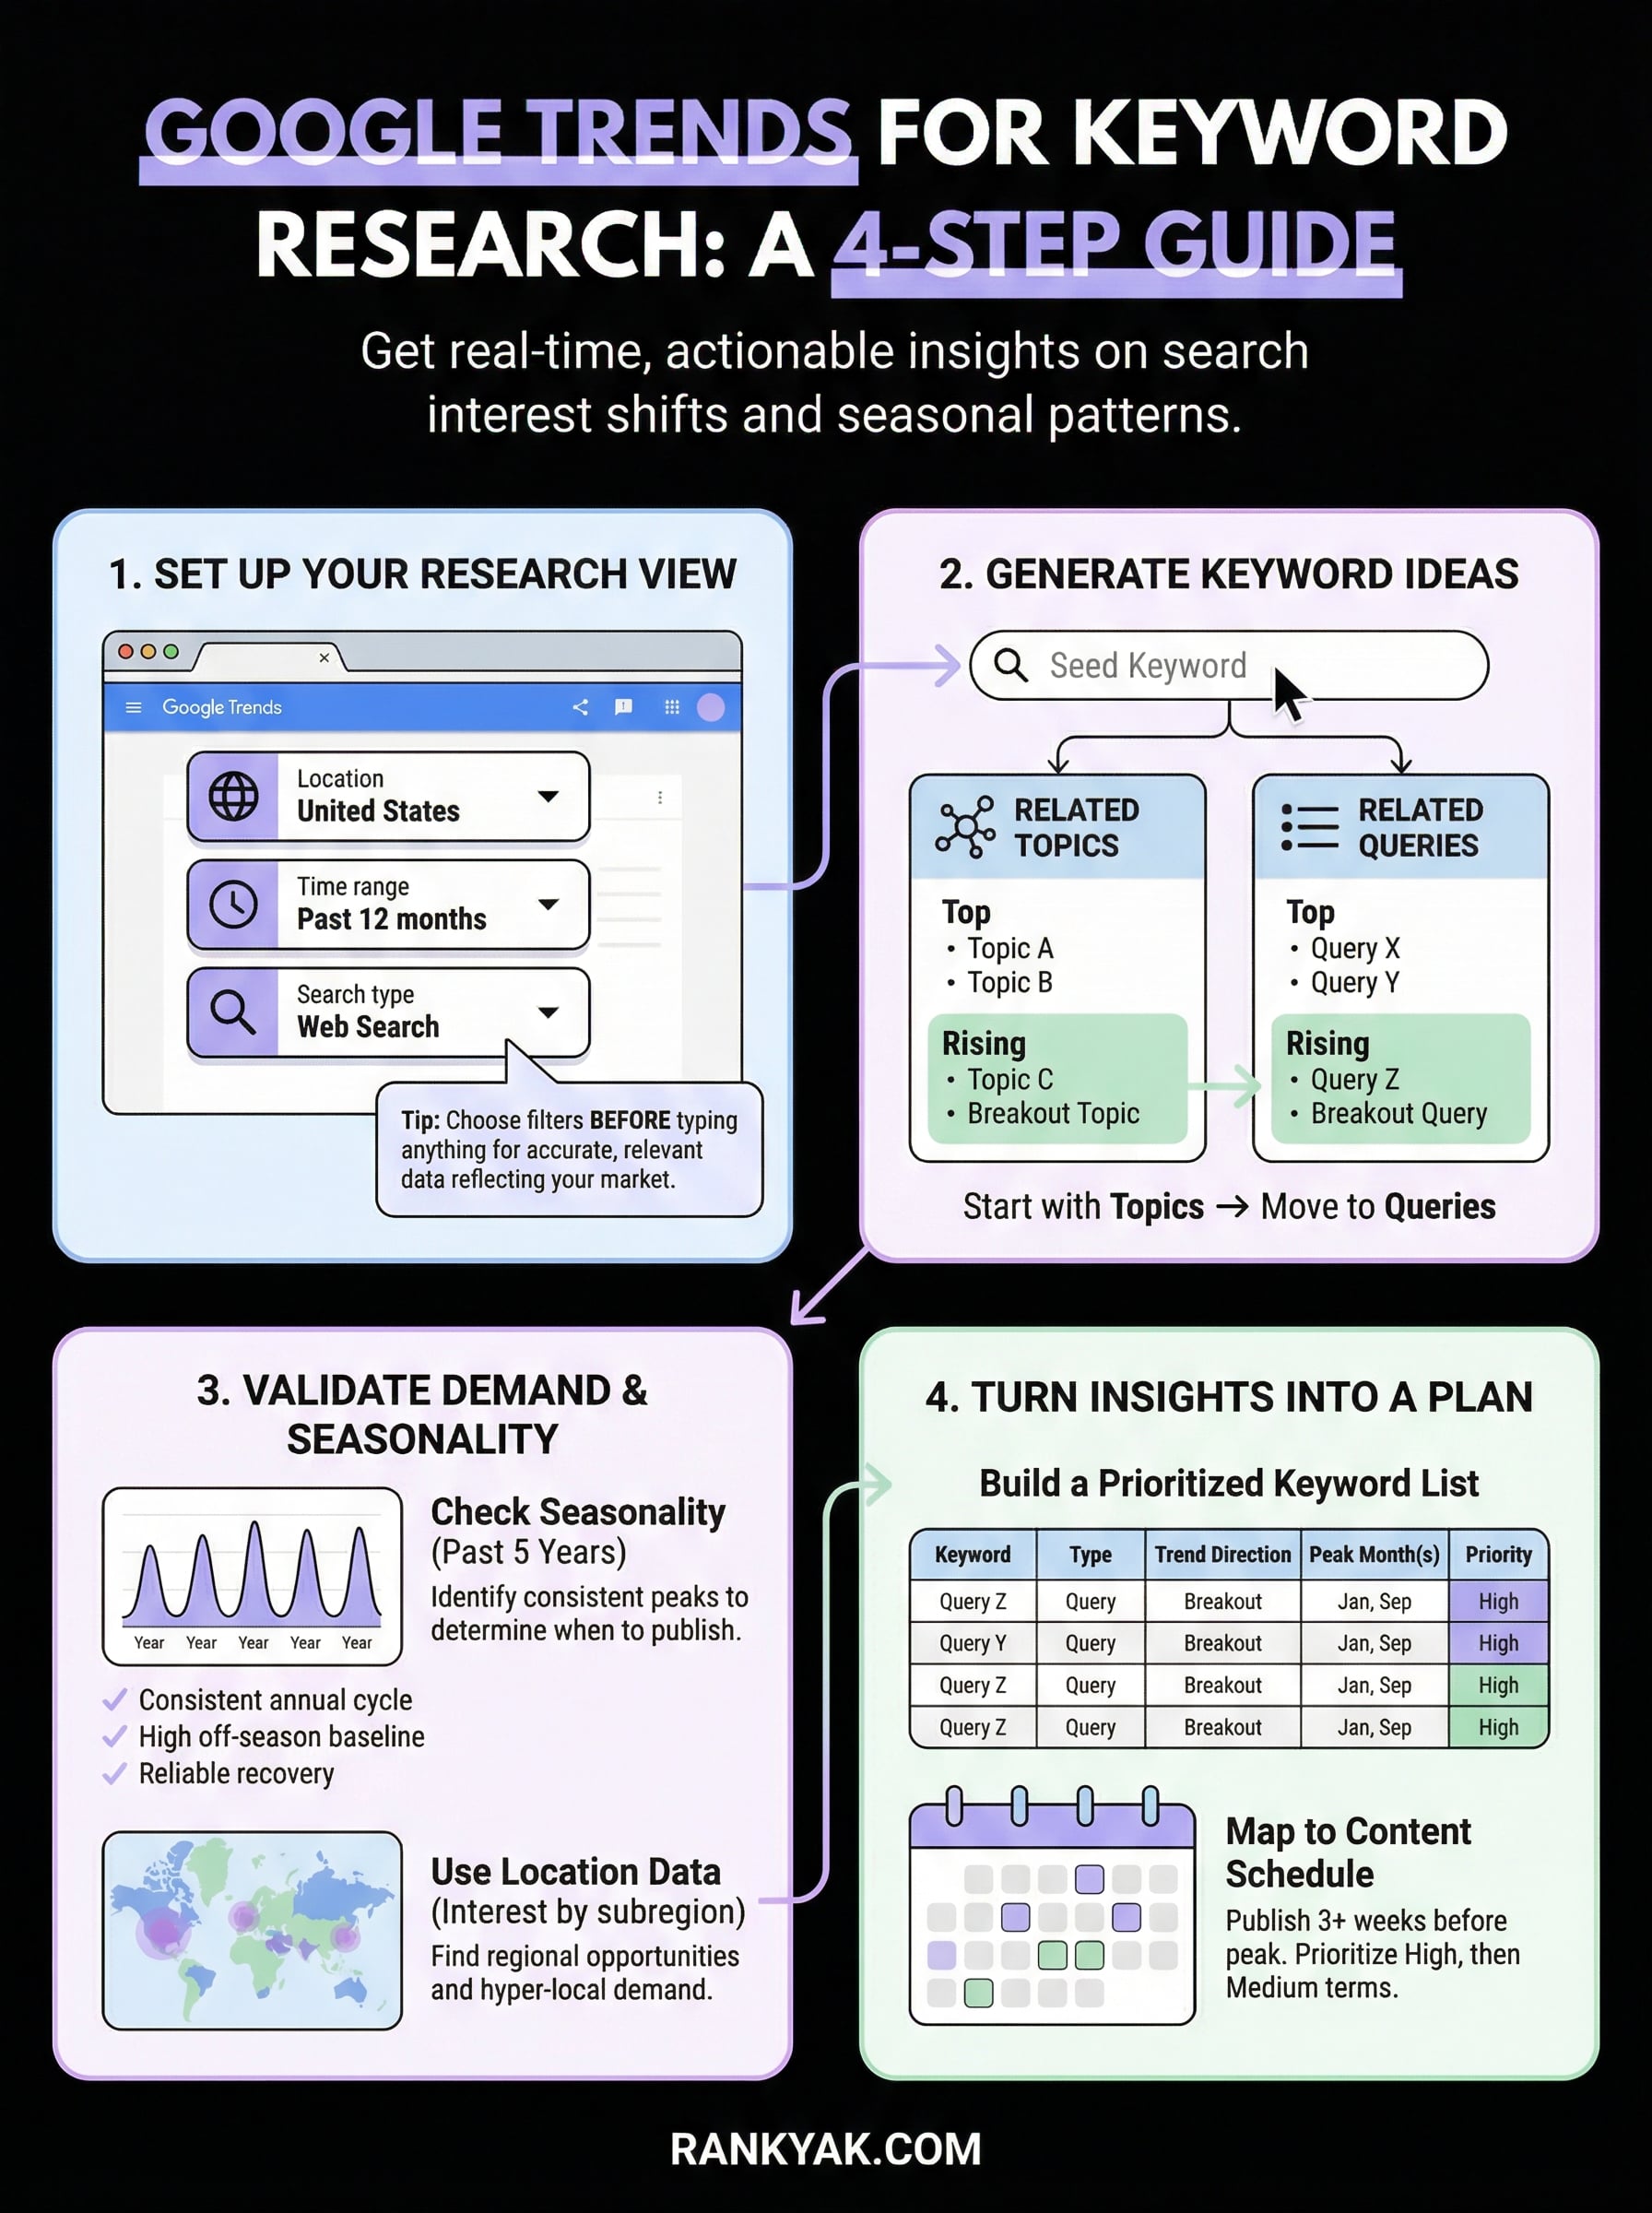
Once your filters are set, type your seed keyword into the search bar and press enter. Google Trends will return a trend line plus two sections below it: "Related Topics" and "Related Queries." These two panels are where most of the keyword research value lives, and knowing how to read them correctly separates useful insights from noise.
Start with Topics, then move to Queries
Topics show you broader concepts that people search for alongside your seed keyword. Because Topics group synonyms and related searches together, they give you a more stable signal than individual query strings. When you use Google Trends for keyword research, always check Topics first to identify adjacent ideas worth exploring. Then switch to Queries to find the exact phrases your audience types, which you can feed directly into your keyword list.

Each panel offers two views: "Top" and "Rising." Top shows the most consistently popular results over your chosen time frame. Rising shows terms that have increased significantly in search interest, and any result labeled "Breakout" has surged over 5,000%.
Focus on "Rising" queries to catch demand before it peaks, giving your content a timing advantage that competitors who rely only on static volume data will miss.
Extract and log what you find
Build a working list as you go. Use a simple table to track what you discover:
| Term | Type (Topic/Query) | Trend direction | Notes |
|---|---|---|---|
| Project management tools | Topic | Rising | Broad, worth validating |
| best project management app | Query | Top | High intent, check volume |
| free project management software | Query | Breakout | Fast-growing, low competition potential |
Repeat this process with two or three seed keywords to build a fuller picture before moving to validation.
Step 3. Validate demand with time, seasonality, and location
A keyword with rising queries means nothing if demand spikes once a year and crashes the rest of the time. Before you build a content plan around any term from Step 2, you need to verify that demand patterns fit your publishing schedule and business goals. This is where the time and location filters you set earlier pay off directly.
Check seasonality before you commit
Switch your time range to "Past 5 years" to see the full seasonal pattern for any keyword you're considering. A term like "tax preparation tips" will show clear annual peaks every January through April. That pattern tells you exactly when to publish, how far in advance to start, and whether the off-season baseline is still worth targeting. If the trend line looks erratic with no repeating cycle, investigate further before committing content resources.
Publishing content two to four weeks before a seasonal peak gives search engines time to index and rank your page before demand reaches its highest point.
Use this checklist to validate each keyword:
- Does the keyword show a consistent seasonal cycle across multiple years?
- Is the off-season baseline high enough to justify the content?
- Does interest recover reliably after each dip?
Use location data to find regional opportunities
Scroll down to the "Interest by subregion" map to see where search interest concentrates geographically. When you use Google Trends for keyword research, this map reveals strong demand in specific states or cities that competitors may be ignoring entirely.
If your business serves a regional market, prioritize keywords with high subregion interest in your area. Filter by state-level data to spot hyper-local demand patterns that broad national keyword tools often miss completely.
Step 4. Turn Trends insights into a keyword list and plan
After completing Steps 1 through 3, you have a set of validated, directional signals from Google Trends. The next move is converting those signals into a structured keyword list you can actually work from. Raw observations sitting in a browser tab are not a strategy. Organizing your findings into a clear document gives you the foundation for a content plan that reflects both search demand and timing.
Build a prioritized keyword list
Use a simple table to consolidate everything you gathered when using Google Trends for keyword research. Prioritize by combining trend direction with seasonal timing so you target keywords when demand is building, not after it peaks. Here is a template to get you started:
| Keyword | Type | Trend direction | Peak month(s) | Priority |
|---|---|---|---|---|
| free project management software | Query | Breakout | January, September | High |
| best project management app | Query | Stable (Top) | Year-round | High |
| project management tools | Topic | Rising | March, October | Medium |
| project management certification | Query | Seasonal | November, December | Medium |
Fill this table before you write a single word of content, because the priority column directly controls your publishing schedule.
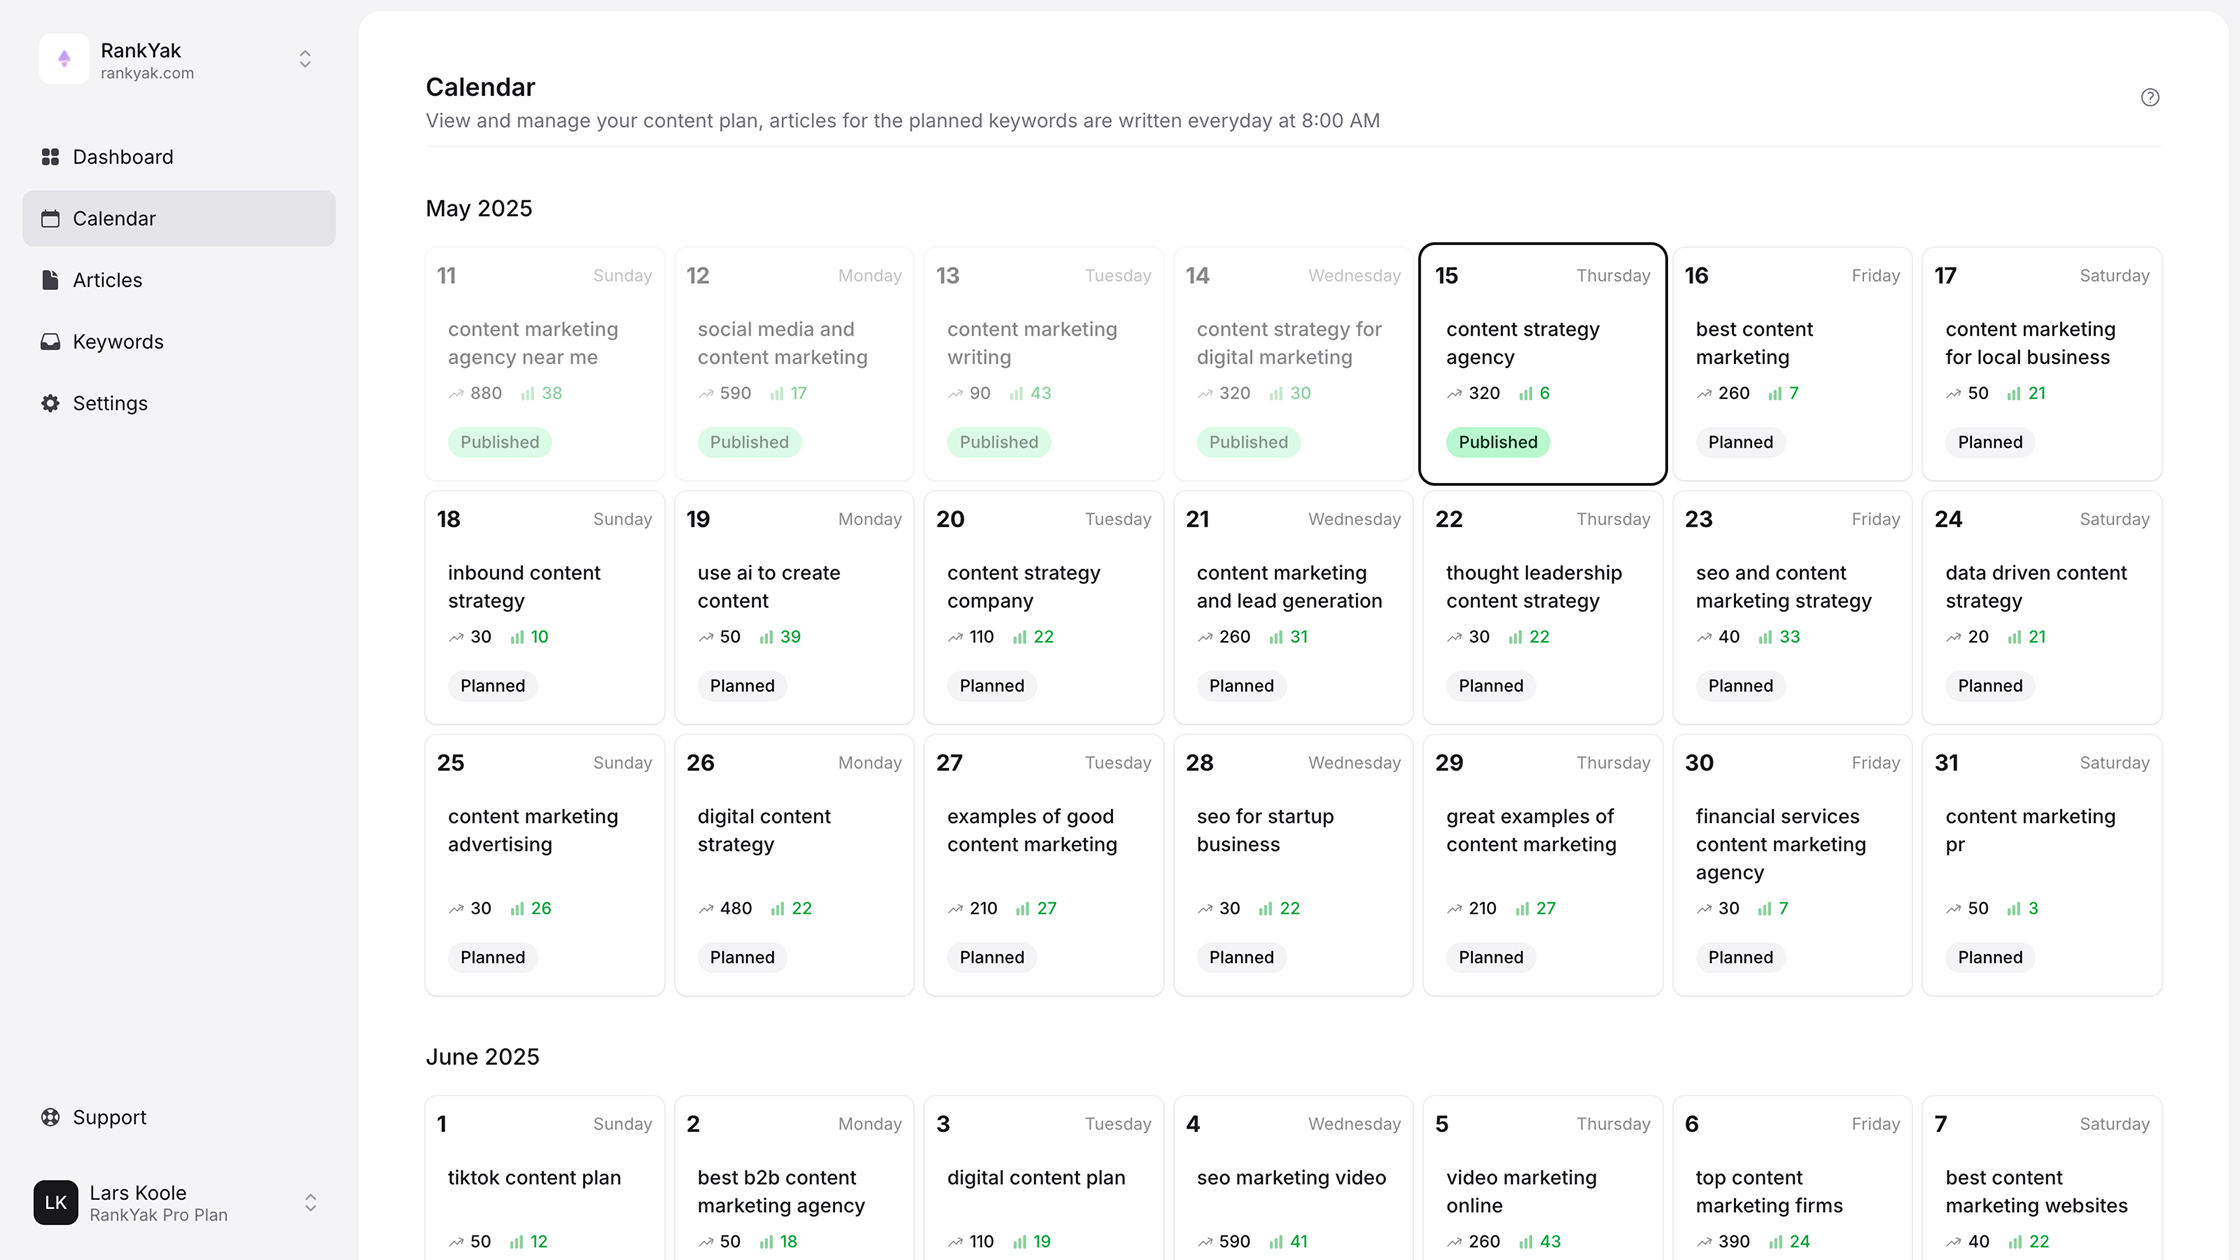
Map keywords to a content schedule
With your prioritized list in hand, work backward from each keyword's peak month. Publish content at least three weeks before the peak so search engines have time to index and rank it. Assign one keyword per article slot in your calendar, ordering High priority terms first and Medium priority terms around them. This process transforms a list of observations into a concrete, time-aware publishing plan you can execute week by week.
Next steps
You now have a complete process for using Google Trends for keyword research, from configuring your filters correctly to building a time-aware publishing schedule around validated demand signals. The four steps in this guide give you a repeatable framework you can run every month to stay ahead of seasonal shifts and catch rising keywords before your competitors do.
Execution is where most people stall. Researching keywords is one thing; turning that research into consistent, optimized content published at the right time is another effort entirely. If you want to skip the manual work, RankYak automates the entire content pipeline for you, from keyword discovery to writing and publishing SEO-optimized articles every day. Start your free 3-day trial and see how much faster your content strategy moves when the execution handles itself.

Get Google and ChatGPT traffic on autopilot.
Start today and generate your first article within 15 minutes.
SEO revenue calculator
How much revenue is your website leaving on the table?
Take a quick quiz and see exactly how much organic revenue you're missing out on, along with personalized tips to fix it.
-
4 questions, under 1 minute
-
See traffic and revenue potential
-
No email required
Free · takes 1 minute · no signup needed
Question 1 of 4
Question 2 of 4
Question 3 of 4
Question 4 of 4
Your SEO growth potential
Extra visitors / month
after 6-12 months of consistent publishing
Revenue potential / year
at your niche's avg. conversion rate
Articles needed (12 mo)
to reach this traffic level
ROI with RankYak
at $99/mo ($1,188/year)
To hit that number, you'd need to:
- Build a topical authority strategy for your niche
- Research keywords & map out a full topical cluster
- Write, edit & publish an article every single day
- Build backlinks to the articles you publish
RankYak handles all of this automatically, every day.
* Estimates based on industry averages. Results vary by niche, competition, and domain authority. Most SEO results become visible after 3-6 months of consistent publishing.